## Line Chart: Accuracy vs. Epochs for Different Methods
### Overview
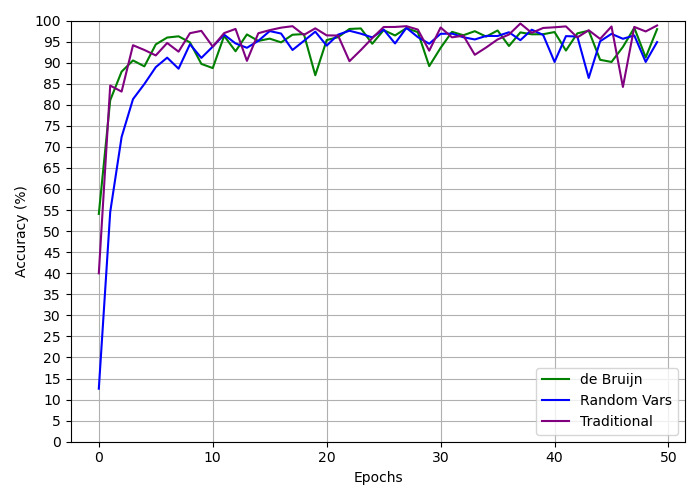
This image presents a line chart comparing the accuracy of three different methods ("de Bruijn", "Random Vars", and "Traditional") over 50 epochs. The y-axis represents accuracy in percentage, while the x-axis represents the number of epochs. The chart displays the learning curves for each method, showing how accuracy changes as training progresses.
### Components/Axes
* **X-axis:** "Epochs" ranging from 0 to 50.
* **Y-axis:** "Accuracy (%)" ranging from 0 to 100.
* **Legend:** Located in the bottom-right corner, identifying the three data series:
* "de Bruijn" - Green line
* "Random Vars" - Blue line
* "Traditional" - Purple line
* **Gridlines:** Vertical gridlines are present to aid in reading values.
### Detailed Analysis
Let's analyze each line individually, noting trends and approximate data points.
* **de Bruijn (Green Line):** This line starts at approximately 15% accuracy at epoch 0. It increases rapidly to around 85% by epoch 5, then fluctuates between approximately 92% and 97% for the remainder of the epochs. Around epoch 45, there's a dip to approximately 93% before recovering slightly.
* **Random Vars (Blue Line):** This line exhibits the most dramatic initial increase. Starting at approximately 15% accuracy at epoch 0, it rises sharply to around 95% by epoch 5. It then fluctuates between approximately 93% and 98% for the rest of the epochs, with a slight dip around epoch 45 to approximately 92%.
* **Traditional (Purple Line):** This line starts at approximately 15% accuracy at epoch 0. It increases steadily to around 90% by epoch 5, then fluctuates between approximately 92% and 96% for the remainder of the epochs. There is a slight dip around epoch 48 to approximately 90%.
Here's a table summarizing approximate accuracy values at specific epochs:
| Epoch | de Bruijn (%) | Random Vars (%) | Traditional (%) |
|-------|---------------|-----------------|-----------------|
| 0 | 15 | 15 | 15 |
| 5 | 85 | 95 | 90 |
| 10 | 94 | 96 | 94 |
| 20 | 95 | 97 | 95 |
| 30 | 96 | 95 | 94 |
| 40 | 96 | 97 | 95 |
| 45 | 93 | 92 | 94 |
| 50 | 95 | 95 | 90 |
### Key Observations
* All three methods achieve high accuracy (above 90%) relatively quickly.
* "Random Vars" initially outperforms the other two methods, reaching the highest accuracy fastest.
* "de Bruijn" and "Traditional" methods show similar performance, with "de Bruijn" slightly outperforming "Traditional" in the later epochs.
* All methods exhibit some degree of fluctuation in accuracy after the initial learning phase, suggesting potential overfitting or instability.
* The dip in accuracy around epochs 45-50 for all methods could indicate a need for regularization or early stopping.
### Interpretation
The data suggests that all three methods are effective in achieving high accuracy. "Random Vars" appears to be the most efficient in terms of initial learning speed. However, the fluctuations in accuracy for all methods suggest that further optimization might be needed to improve generalization performance. The similar performance of "de Bruijn" and "Traditional" indicates that the choice between them might depend on other factors, such as computational cost or implementation complexity. The dip in accuracy towards the end of training suggests that the models may be starting to overfit the training data, and techniques like regularization or early stopping could be employed to mitigate this issue. The chart demonstrates the learning process of these methods, highlighting their strengths and weaknesses in terms of convergence and stability.