## Line Graph: Accuracy vs. Epochs for Different Methods
### Overview
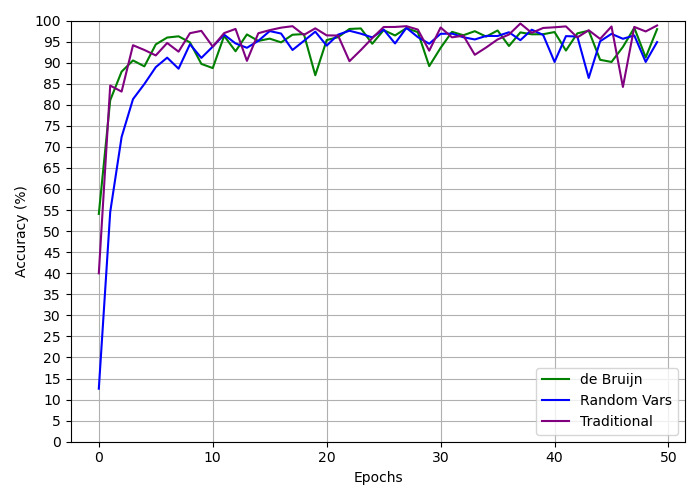
The image is a line graph comparing the accuracy (%) of three methods—**de Bruijn**, **Random Vars**, and **Traditional**—over 50 epochs. The y-axis represents accuracy (0–100%), and the x-axis represents epochs (0–50). All three methods show convergence toward higher accuracy as epochs increase, with distinct initial performance and fluctuation patterns.
---
### Components/Axes
- **X-axis (Epochs)**: Labeled "Epochs," ranging from 0 to 50 in increments of 10.
- **Y-axis (Accuracy %)**: Labeled "Accuracy (%)", ranging from 0 to 100 in increments of 5.
- **Legend**: Located in the **bottom-right corner**, with three entries:
- **Green**: de Bruijn
- **Blue**: Random Vars
- **Purple**: Traditional
---
### Detailed Analysis
1. **de Bruijn (Green Line)**:
- Starts at ~55% accuracy at epoch 0.
- Shows moderate fluctuations but maintains a steady upward trend.
- Peaks near 95–100% by epoch 50, with minor dips (e.g., ~85% at epoch 30).
2. **Random Vars (Blue Line)**:
- Starts at ~10% accuracy at epoch 0, the lowest initial value.
- Rapidly ascends to ~90% by epoch 10, then stabilizes with minor oscillations.
- Ends near 95% accuracy at epoch 50.
3. **Traditional (Purple Line)**:
- Starts at ~40% accuracy at epoch 0.
- Exhibits significant volatility, with sharp peaks (~95%) and troughs (~85% at epoch 30).
- Ends near 95% accuracy at epoch 50.
**Key Data Points**:
- All lines converge toward 95–100% accuracy by epoch 50.
- Random Vars has the steepest initial rise (10% → 90% in 10 epochs).
- Traditional shows the most variability, with a notable dip to ~85% at epoch 30.
---
### Key Observations
- **Initial Disparity**: Random Vars starts far below the other methods but catches up quickly.
- **Convergence**: All methods achieve similar high accuracy (~95–100%) by epoch 50.
- **Volatility**: Traditional exhibits the most fluctuation, while de Bruijn is relatively stable.
- **Crossovers**: Lines intersect multiple times (e.g., de Bruijn and Traditional cross near epoch 10).
---
### Interpretation
The graph demonstrates that **all three methods improve with more epochs**, but their **initial performance and stability differ**:
- **Random Vars** is the weakest performer initially but accelerates rapidly, suggesting it may require fewer epochs to reach high accuracy.
- **Traditional** has the highest variability, possibly due to sensitivity to hyperparameters or data noise.
- **de Bruijn** balances moderate initial performance with steady improvement, making it a reliable choice for consistent results.
The convergence at epoch 50 implies that **longer training stabilizes performance across methods**, though Random Vars and Traditional may require careful tuning to avoid early underperformance. The dips in Traditional’s accuracy (e.g., epoch 30) highlight potential instability in its learning process.