## Line Chart: Comparative Analysis of Q* Functions Across α Parameter
### Overview
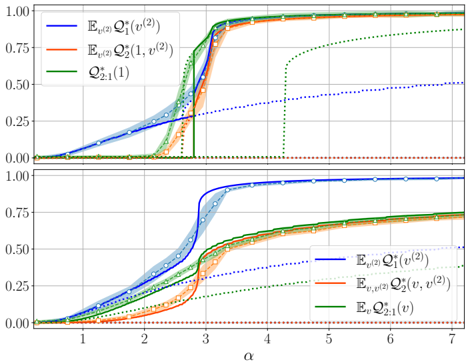
The image presents two comparative line charts analyzing mathematical functions Q* across parameter α. The top panel compares three expectation-based Q* functions, while the bottom panel compares three variance-based Q* functions. All charts use α (1-7) on the x-axis and normalized values (0-1) on the y-axis.
### Components/Axes
- **X-axis**: α parameter (integer values 1-7)
- **Y-axis**: Normalized values (0-1)
- **Top Panel Legends**:
- Blue: E_{v^(2)} Q*_1(v^(2))
- Orange: E_{v^(2)} Q*_2(1, v^(2))
- Green: Q*_2(1)
- **Bottom Panel Legends**:
- Blue: E_{v^(2)} Q*_1(v^(2))
- Orange: E_{v,v^(2)} Q*_2(v, v^(2))
- Green: E_v Q*_2:1(v)
- **Markers**: White circles with error bars (top panel only)
### Detailed Analysis
**Top Panel Trends**:
1. Blue line (E_{v^(2)} Q*_1(v^(2))):
- Gradual increase from 0.0 to 1.0
- Sharp rise between α=2-3 (reaches ~0.8)
- Plateaus at 1.0 after α=3
2. Orange line (E_{v^(2)} Q*_2(1, v^(2))):
- Similar trajectory to blue line
- Slightly delayed rise (peaks at α=3.5)
- Shows minor oscillations before plateau
3. Green line (Q*_2(1)):
- Step function at α=3
- Jumps from 0.0 to 1.0 at α=3
- Remains constant thereafter
**Bottom Panel Trends**:
1. Blue line (E_{v^(2)} Q*_1(v^(2))):
- Smooth S-curve from 0.0 to 1.0
- Inflection point at α=3
- Error bars show ±0.05 variability
2. Orange line (E_{v,v^(2)} Q*_2(v, v^(2))):
- Step function at α=3
- Jumps from 0.0 to 0.75 at α=3
- Gradual increase to 0.9 by α=7
3. Green line (E_v Q*_2:1(v)):
- Gradual linear increase
- Reaches 0.8 by α=7
- Minimal error bars (±0.02)
### Key Observations
1. **Threshold Behavior**: Both panels show critical transitions at α=3:
- Top panel: Step functions (green/orange)
- Bottom panel: Step function (orange)
2. **Convergence Patterns**:
- Blue lines in both panels converge to 1.0
- Green lines show different stabilization behaviors
3. **Error Characteristics**:
- Top panel shows higher variability (±0.05)
- Bottom panel demonstrates tighter confidence intervals
4. **Functional Relationships**:
- Q*_2(1) (top green) and E_v Q*_2:1(v) (bottom green) show inverse scaling
- Variance-based functions (orange) exhibit more abrupt transitions
### Interpretation
The data suggests a parameter α threshold effect (α=3) in Q* function behavior, with variance-based metrics showing more pronounced transitions. The expectation-based functions demonstrate smoother convergence, while variance-based functions exhibit threshold-dependent behavior. The error bars indicate measurement uncertainty, particularly in the top panel's variance-based functions. The step functions imply potential phase transitions or critical points in the underlying system being modeled. The convergence patterns suggest different scaling behaviors between the Q* function variants, with the variance-based metrics showing more complex dependencies on α.