## Diagram: Input-Output Transformation
### Overview
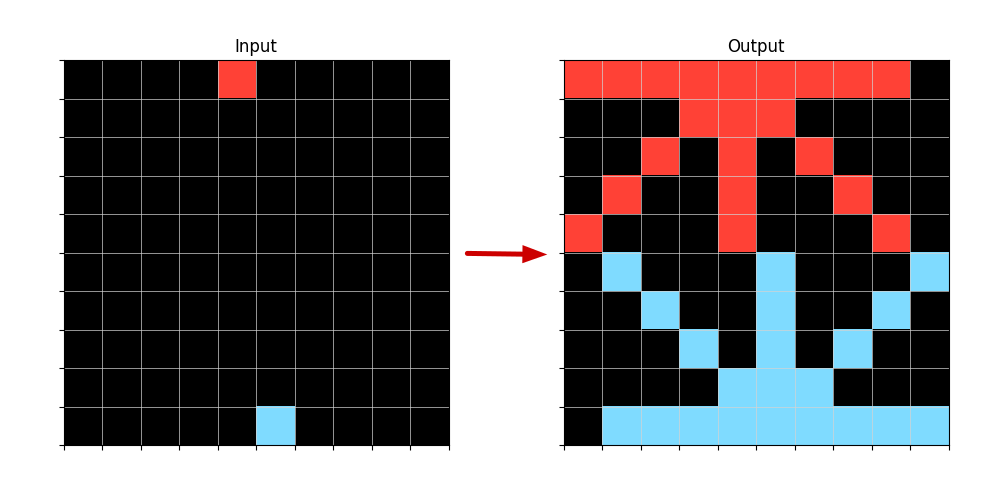
The image shows a transformation diagram. It depicts an 8x8 grid labeled "Input" on the left, which is mostly black with a single red square in the top-left corner and a single light blue square in the bottom-left corner. An arrow points from the "Input" grid to an "Output" grid on the right. The "Output" grid shows a transformed pattern of red and light blue squares against a black background.
### Components/Axes
* **Input Grid:** An 8x8 grid labeled "Input" at the top. The grid cells are primarily black, with one red cell at the top-left (row 1, column 1) and one light blue cell at the bottom-left (row 8, column 1).
* **Output Grid:** An 8x8 grid labeled "Output" at the top. The grid cells contain a pattern of red and light blue cells against a black background.
* **Transformation Arrow:** A red arrow pointing from the "Input" grid to the "Output" grid, indicating a transformation process.
### Detailed Analysis or ### Content Details
**Input Grid:**
* The grid is 8x8.
* The majority of the cells are black.
* One cell is red, located at row 1, column 1.
* One cell is light blue, located at row 8, column 1.
**Output Grid:**
* The grid is 8x8.
* The grid contains a pattern of red and light blue cells against a black background.
* **Red Cells:**
* Row 1: Columns 1, 2, 6, 7, 8
* Row 2: Columns 1, 2, 6, 7, 8
* Row 3: Columns 1, 6
* Row 4: Columns 1, 6
* **Light Blue Cells:**
* Row 5: Columns 1, 3, 5, 7
* Row 6: Columns 2, 4, 6
* Row 7: Columns 1, 2, 3, 4, 5, 6, 7, 8
* Row 8: Columns 1, 2, 3, 4, 5, 6, 7, 8
### Key Observations
* The "Input" grid has only two colored cells, one red and one light blue, both located in the first column.
* The "Output" grid shows a more complex pattern of red and light blue cells.
* The red cells in the "Output" grid are concentrated in the upper rows, while the light blue cells are concentrated in the lower rows.
### Interpretation
The diagram illustrates a transformation process where a simple "Input" pattern is converted into a more complex "Output" pattern. The transformation appears to distribute the initial red and light blue cells from the first column of the "Input" grid into a specific arrangement in the "Output" grid. This could represent a simplified model of a neural network layer, where the input signals are processed and transformed into a different output representation. The specific pattern in the "Output" grid suggests a defined transformation rule or algorithm.