## Diagram: Input-to-Output Transformation
### Overview
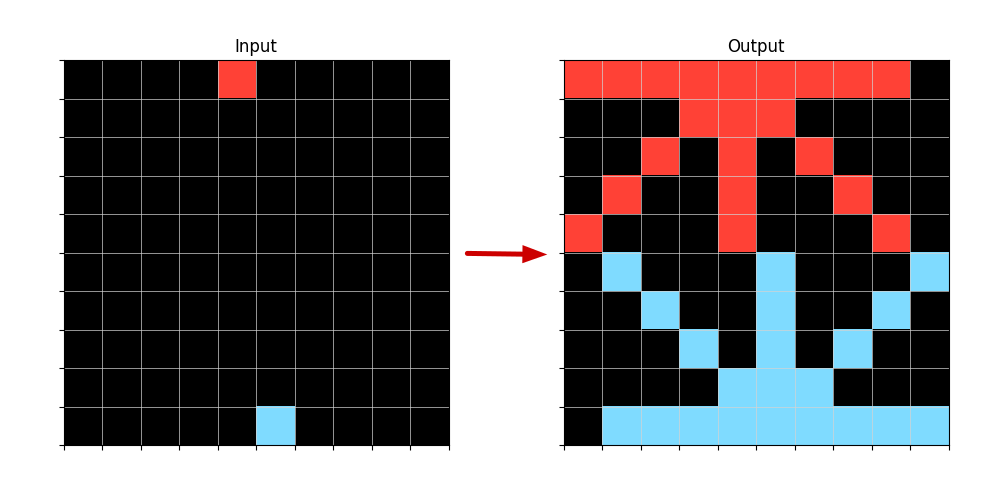
The image depicts a two-grid system labeled "Input" (left) and "Output" (right), connected by a red arrow. Both grids are composed of a 10x10 matrix of black cells, with specific cells colored red or blue. The Input grid contains two colored cells, while the Output grid contains 14 colored cells arranged in a structured pattern.
### Components/Axes
- **Grid Structure**:
- Both grids are 10x10 matrices with no labeled axes or scales.
- Cells are uniformly sized and separated by thin white lines.
- **Color Coding**:
- **Red**: Appears in the Input grid (1 cell) and Output grid (9 cells).
- **Blue**: Appears in the Input grid (1 cell) and Output grid (5 cells).
- No explicit legend is provided to define the meaning of colors.
- **Arrow**: A bold red arrow connects the Input and Output grids, indicating a directional transformation.
### Detailed Analysis
#### Input Grid
- **Red Cell**: Located at the top-center of the grid (row 1, column 5).
- **Blue Cell**: Located at the bottom-center of the grid (row 10, column 5).
#### Output Grid
- **Red Cells**:
- Form a vertical column in the center (rows 1–5, column 5).
- Additional red cells are positioned symmetrically around the central column:
- Row 1, columns 3 and 7.
- Row 3, columns 2 and 8.
- Row 5, columns 1 and 9.
- **Blue Cells**:
- Form a horizontal line at the bottom (rows 6–10, columns 3–7).
### Key Observations
1. **Symmetry and Distribution**:
- The Output grid’s red cells exhibit radial symmetry around the central column, while blue cells form a uniform horizontal band.
2. **Cell Count Increase**:
- Input has 2 colored cells; Output has 14, suggesting a multiplicative or expansive process.
3. **Color Proportions**:
- Red dominates the Output (9/14 cells), while blue is less frequent but spatially concentrated.
### Interpretation
The diagram likely represents a **rule-based transformation** or **state evolution** system. The Input’s two cells (red and blue) may act as "seeds" that propagate into the Output’s complex pattern. The red cells’ radial spread could symbolize activation or influence spreading outward, while the blue cells’ horizontal alignment might indicate stabilization or grounding.
The absence of numerical data or legends limits quantitative analysis, but the spatial logic suggests a **cellular automaton** or **spatial propagation model**. The red arrow emphasizes causality, implying the Input directly generates the Output through predefined rules.
**Notable Anomalies**:
- The Input’s simplicity contrasts sharply with the Output’s complexity, highlighting a non-linear transformation.
- The blue cells in the Output are confined to the lower half, possibly indicating a boundary condition or termination state.