## Chart: Validation Loss vs. FLOPS for Different Data Splits
### Overview
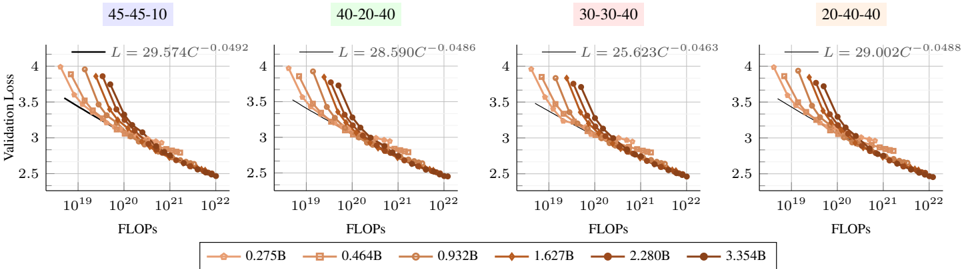
The image presents four separate line charts, each depicting the relationship between Validation Loss (y-axis) and FLOPS (x-axis) for different data split configurations. Each chart represents a different split ratio: 45-45-10, 40-20-40, 30-30-40, and 20-40-40. Within each chart, multiple lines represent different batch sizes (0.275B, 0.464B, 0.932B, 1.627B, 2.280B, and 3.354B). Each chart also includes a linear equation representing the trendline.
### Components/Axes
* **X-axis:** FLOPS (Floating Point Operations Per Second), scaled logarithmically from 10<sup>19</sup> to 10<sup>22</sup>.
* **Y-axis:** Validation Loss, scaled linearly from 2.5 to 4.
* **Chart Titles:** Located at the top of each chart, indicating the data split ratio (45-45-10, 40-20-40, 30-30-40, 20-40-40).
* **Legend:** Located at the bottom of the image, horizontally aligned. It maps colors to batch sizes:
* Orange: 0.275B
* Light Orange: 0.464B
* Dark Orange: 0.932B
* Brown: 1.627B
* Dark Brown: 2.280B
* Maroon: 3.354B
* **Trendlines:** Each chart displays a linear equation of the form L = aC<sup>b</sup>, where L is Validation Loss, C is FLOPS, and a and b are coefficients.
### Detailed Analysis or Content Details
**Chart 1: 45-45-10**
* Trend: All lines slope downwards, indicating that as FLOPS increase, Validation Loss decreases. The lines are relatively close together, suggesting batch size has a moderate effect.
* Equation: L = 29.574C<sup>-0.0492</sup>
* Data Points (approximate):
* 0.275B: At FLOPS ~10<sup>19</sup>, Loss ~3.9; At FLOPS ~10<sup>22</sup>, Loss ~2.6
* 0.464B: At FLOPS ~10<sup>19</sup>, Loss ~3.8; At FLOPS ~10<sup>22</sup>, Loss ~2.6
* 0.932B: At FLOPS ~10<sup>19</sup>, Loss ~3.7; At FLOPS ~10<sup>22</sup>, Loss ~2.5
* 1.627B: At FLOPS ~10<sup>19</sup>, Loss ~3.6; At FLOPS ~10<sup>22</sup>, Loss ~2.5
* 2.280B: At FLOPS ~10<sup>19</sup>, Loss ~3.5; At FLOPS ~10<sup>22</sup>, Loss ~2.4
* 3.354B: At FLOPS ~10<sup>19</sup>, Loss ~3.4; At FLOPS ~10<sup>22</sup>, Loss ~2.4
**Chart 2: 40-20-40**
* Trend: Similar to Chart 1, all lines slope downwards. The lines are again relatively close.
* Equation: L = 28.590C<sup>-0.0486</sup>
* Data Points (approximate):
* 0.275B: At FLOPS ~10<sup>19</sup>, Loss ~3.8; At FLOPS ~10<sup>22</sup>, Loss ~2.6
* 0.464B: At FLOPS ~10<sup>19</sup>, Loss ~3.7; At FLOPS ~10<sup>22</sup>, Loss ~2.5
* 0.932B: At FLOPS ~10<sup>19</sup>, Loss ~3.6; At FLOPS ~10<sup>22</sup>, Loss ~2.4
* 1.627B: At FLOPS ~10<sup>19</sup>, Loss ~3.5; At FLOPS ~10<sup>22</sup>, Loss ~2.4
* 2.280B: At FLOPS ~10<sup>19</sup>, Loss ~3.4; At FLOPS ~10<sup>22</sup>, Loss ~2.3
* 3.354B: At FLOPS ~10<sup>19</sup>, Loss ~3.3; At FLOPS ~10<sup>22</sup>, Loss ~2.3
**Chart 3: 30-30-40**
* Trend: Downward slope for all lines. The lines appear slightly more spread out than in the previous charts.
* Equation: L = 25.623C<sup>-0.0483</sup>
* Data Points (approximate):
* 0.275B: At FLOPS ~10<sup>19</sup>, Loss ~3.7; At FLOPS ~10<sup>22</sup>, Loss ~2.5
* 0.464B: At FLOPS ~10<sup>19</sup>, Loss ~3.6; At FLOPS ~10<sup>22</sup>, Loss ~2.4
* 0.932B: At FLOPS ~10<sup>19</sup>, Loss ~3.5; At FLOPS ~10<sup>22</sup>, Loss ~2.4
* 1.627B: At FLOPS ~10<sup>19</sup>, Loss ~3.4; At FLOPS ~10<sup>22</sup>, Loss ~2.3
* 2.280B: At FLOPS ~10<sup>19</sup>, Loss ~3.3; At FLOPS ~10<sup>22</sup>, Loss ~2.3
* 3.354B: At FLOPS ~10<sup>19</sup>, Loss ~3.2; At FLOPS ~10<sup>22</sup>, Loss ~2.2
**Chart 4: 20-40-40**
* Trend: Downward slope for all lines. The lines are relatively close together.
* Equation: L = 29.002C<sup>-0.0488</sup>
* Data Points (approximate):
* 0.275B: At FLOPS ~10<sup>19</sup>, Loss ~3.8; At FLOPS ~10<sup>22</sup>, Loss ~2.6
* 0.464B: At FLOPS ~10<sup>19</sup>, Loss ~3.7; At FLOPS ~10<sup>22</sup>, Loss ~2.5
* 0.932B: At FLOPS ~10<sup>19</sup>, Loss ~3.6; At FLOPS ~10<sup>22</sup>, Loss ~2.5
* 1.627B: At FLOPS ~10<sup>19</sup>, Loss ~3.5; At FLOPS ~10<sup>22</sup>, Loss ~2.4
* 2.280B: At FLOPS ~10<sup>19</sup>, Loss ~3.4; At FLOPS ~10<sup>22</sup>, Loss ~2.4
* 3.354B: At FLOPS ~10<sup>19</sup>, Loss ~3.3; At FLOPS ~10<sup>22</sup>, Loss ~2.3
### Key Observations
* The Validation Loss consistently decreases as FLOPS increase across all data split configurations and batch sizes.
* The batch size has a relatively small impact on the Validation Loss, with the lines generally remaining close together within each chart.
* The 30-30-40 split appears to have the lowest overall Validation Loss across the range of FLOPS.
* The equations show a negative exponent for FLOPS, confirming the inverse relationship between FLOPS and Validation Loss.
### Interpretation
The charts demonstrate the impact of computational resources (FLOPS) and data split configurations on model performance (Validation Loss). The consistent downward trend indicates that increasing FLOPS generally leads to improved model accuracy, as measured by lower Validation Loss. The relatively small effect of batch size suggests that, within the tested range, the data split configuration is a more significant factor in determining performance. The 30-30-40 split consistently yields the lowest Validation Loss, suggesting it may be the optimal configuration for this particular model and dataset. The linear equations provide a quantitative relationship between FLOPS and Validation Loss, which can be used to predict performance for different computational budgets. The data suggests diminishing returns as FLOPS increase, as the rate of loss reduction slows down at higher FLOPS values. This implies that there is a point beyond which increasing FLOPS provides only marginal improvements in model accuracy.