## Line Charts: Scaling Laws for Validation Loss vs. Compute (FLOPs) Across Four Configurations
### Overview
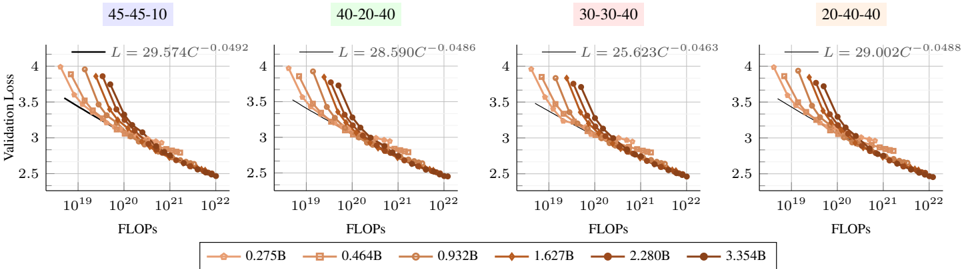
The image displays four horizontally arranged line charts, each plotting "Validation Loss" against "FLOPs" (Floating Point Operations) on a logarithmic scale. Each chart corresponds to a different configuration, labeled with a three-part ratio (e.g., 45-45-10). The charts collectively illustrate how model validation loss scales with increased computational resources for models of varying sizes, under four distinct experimental setups. A shared legend at the bottom identifies six different model sizes.
### Components/Axes
* **Chart Titles (Top of each panel, left to right):**
1. `45-45-10` (Light purple background)
2. `40-20-40` (Light green background)
3. `30-30-40` (Light pink background)
4. `20-40-40` (Light orange background)
* **Y-Axis (Common to all charts):**
* **Label:** `Validation Loss`
* **Scale:** Linear, ranging from 2.5 to 4.0.
* **Tick Marks:** 2.5, 3.0, 3.5, 4.0.
* **X-Axis (Common to all charts):**
* **Label:** `FLOPs`
* **Scale:** Logarithmic (base 10).
* **Tick Marks:** `10^19`, `10^20`, `10^21`, `10^22`.
* **Legend (Bottom center, spanning all charts):**
* Contains six entries, each with a unique marker shape and color gradient from light orange to dark brown.
* **Model Sizes (Parameter Counts):** `0.275B`, `0.464B`, `0.932B`, `1.627B`, `2.280B`, `3.354B`. (B likely denotes Billion parameters).
* **Fitted Equations (Top-right corner of each chart panel):**
* Each chart displays a power-law fit equation of the form `L = a * C^b`, where `L` is Validation Loss and `C` is FLOPs.
* **45-45-10:** `L = 29.574C^(-0.0492)`
* **40-20-40:** `L = 28.590C^(-0.0486)`
* **30-30-40:** `L = 25.623C^(-0.0463)`
* **20-40-40:** `L = 29.002C^(-0.0488)`
### Detailed Analysis
* **Data Series Trend (All Charts):** For every model size (each colored line), Validation Loss decreases monotonically as FLOPs increase. The relationship appears linear on this log-linear plot, confirming the power-law scaling indicated by the fitted equations.
* **Model Size Comparison (Within a Chart):** At any given FLOPs value (e.g., 10^20), larger models (darker brown lines) consistently achieve lower Validation Loss than smaller models (lighter orange lines). The lines are roughly parallel, suggesting similar scaling exponents across model sizes within a configuration.
* **Cross-Configuration Comparison:**
* The scaling exponent `b` in the fitted equations is very similar across all four configurations, ranging from approximately -0.0463 to -0.0492. This indicates a consistent rate of loss improvement per order-of-magnitude increase in compute.
* The scaling coefficient `a` varies more noticeably. The `30-30-40` configuration has the lowest coefficient (25.623), suggesting it may achieve a better absolute loss for a given amount of compute compared to the others, whose coefficients cluster around 28.6-29.6.
* **Data Point Distribution:** The plotted data points for each model size span roughly 1.5 to 2 orders of magnitude in FLOPs (e.g., the 3.354B model data runs from ~10^20 to ~10^22 FLOPs). The points are densely clustered, forming clear, smooth curves.
### Key Observations
1. **Universal Scaling Law:** The data strongly supports a power-law relationship between validation loss and computational resources (FLOPs) for language model training, consistent across different architectural configurations.
2. **Predictable Improvement:** The near-identical scaling exponents (`b ≈ -0.048`) suggest a fundamental and predictable rate of return on investment for additional compute.
3. **Configuration Impact:** While the scaling *rate* is robust, the absolute performance (coefficient `a`) is sensitive to the configuration (the ratios in the titles). The `30-30-40` setup appears most efficient in this metric.
4. **Model Size Advantage:** Larger models are more compute-efficient at achieving a target loss level. To reach a Validation Loss of 3.0, a 3.354B model requires significantly fewer FLOPs than a 0.275B model.
### Interpretation
This visualization provides empirical evidence for scaling laws in neural language models. The core finding is that **validation loss improves as a predictable power law of the computational budget (FLOPs) invested in training**, and this relationship holds across a range of model sizes and architectural configurations.
The ratios in the titles (e.g., 45-45-10) likely represent a distribution of model parameters or compute across different components (e.g., attention layers, feed-forward networks, embedding size). The analysis reveals that while the fundamental scaling exponent is a robust property, the **absolute efficiency (the constant multiplier in the power law) can be optimized by tuning this configuration**. The `30-30-40` configuration demonstrates superior efficiency in this experiment.
For practitioners, this implies two key strategies: 1) **Scaling compute is a reliable, if diminishing-returns, path to better performance.** 2) **Architectural configuration tuning offers a lever to improve the absolute performance achieved for a given compute budget,** even if it doesn't change the underlying scaling rate. The charts serve as a tool for predicting the compute required to reach a target loss for a given model size and configuration.