## Line Chart: Accuracy of Four AI Models Across Math Topics
### Overview
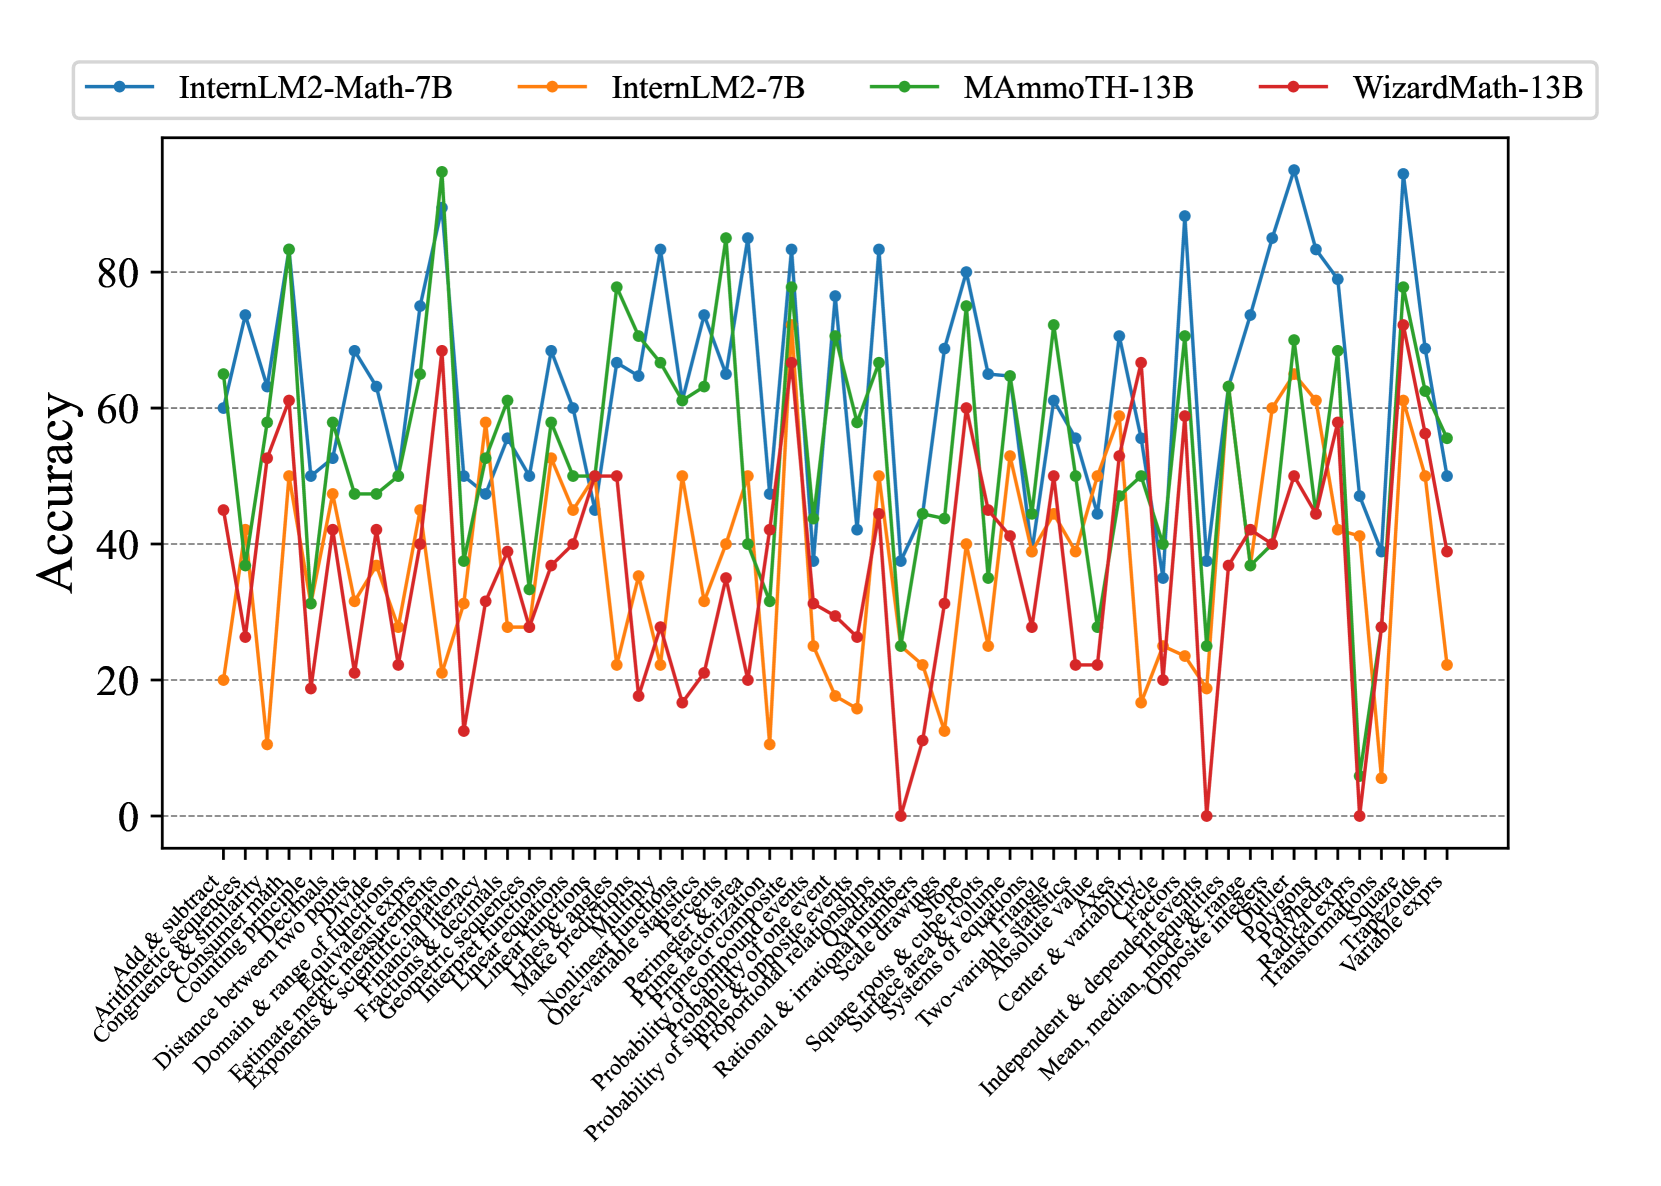
This image is a line chart comparing the accuracy percentages of four different AI models across a wide range of mathematical topics. The chart displays performance variability, with each model showing distinct strengths and weaknesses depending on the specific math domain.
### Components/Axes
* **Chart Type:** Multi-series line chart with markers.
* **Y-Axis:** Labeled "Accuracy". Scale ranges from 0 to approximately 90, with major gridlines at intervals of 20 (0, 20, 40, 60, 80).
* **X-Axis:** Lists 50 distinct mathematical topics or problem categories. The labels are rotated for readability.
* **Legend:** Positioned at the top of the chart, centered. It identifies four data series:
* **InternLM2-Math-7B:** Blue line with circle markers.
* **InternLM2-7B:** Orange line with circle markers.
* **MAmmoTH-13B:** Green line with circle markers.
* **WizardMath-13B:** Red line with circle markers.
### Detailed Analysis
**X-Axis Categories (Math Topics):**
The topics listed from left to right are:
Add & subtract, Arithmetic sequences, Congruence & similarity, Counting principles, Decimals, Distance between two points, Divide, Domain & range of funcs, Equivalent expressions, Exponents & scientific notation, Fractions, Geometric sequences, Interpret functions, Linear equations, Linear functions, Logarithms & exps, Make predictions, Matrices, Nonlinear functions, One-variable statistics, Perimeter & area, Permutations, Prime factorization, Probability of compound events, Probability of one event, Proportional relationships, Rational & irrational numbers, Scale drawings, Simple & compound events, Square roots & cube roots, Surface area & volume, Systems of equations, Two-variable statistics, Absolute value, Center & variability, Circle, Factors, Independent & dependent events, Inequalities, Inscribed angles, Mean/median/mode/range, Opposite integers, Outliers, Polygons, Polyhedra, Radical expressions, Transformations, Trapezoids, Variable expressions.
**Data Series Trends & Approximate Values:**
* **InternLM2-Math-7B (Blue):** Generally the highest-performing model. Shows high variability but frequently peaks above 80% accuracy. Notable high points include "Polygons" (~95%), "Transformations" (~95%), and "Geometric sequences" (~85%). Its lowest points are around 40-50% for topics like "Probability of compound events" and "Systems of equations".
* **InternLM2-7B (Orange):** Typically the lowest-performing model. Accuracy mostly fluctuates between 20% and 60%. It has a few peaks near 60% (e.g., "Matrices", "Polygons") and several dips below 20% (e.g., "Divide", "Logarithms & exps", "Probability of compound events").
* **MAmmoTH-13B (Green):** Shows very high volatility. It achieves some of the highest peaks on the chart, such as "Domain & range of funcs" (~95%) and "Geometric sequences" (~85%), but also experiences severe drops, including near 0% for "Probability of compound events" and "Independent & dependent events".
* **WizardMath-13B (Red):** Also highly volatile, with a performance range from near 0% to over 70%. It has several points at or near 0% accuracy (e.g., "Probability of compound events", "Independent & dependent events", "Opposite integers"). Its highest performance is around 70% for topics like "Polygons" and "Transformations".
### Key Observations
1. **Topic-Specific Performance:** No single model dominates across all topics. Performance is highly dependent on the specific math domain.
2. **Common Struggles:** All models show a significant performance drop for "Probability of compound events", with MAmmoTH-13B and WizardMath-13B hitting near 0%.
3. **Specialization:** The "InternLM2-Math-7B" model, which likely has specialized math training, consistently outperforms the base "InternLM2-7B" model, demonstrating the value of domain-specific fine-tuning.
4. **High Variability:** The green (MAmmoTH-13B) and red (WizardMath-13B) lines exhibit extreme swings, suggesting their performance is less stable and more sensitive to the problem type compared to the blue line.
5. **Geometry Strength:** Several models, particularly the blue and green ones, show relatively strong performance on geometry-related topics like "Polygons", "Transformations", and "Geometric sequences".
### Interpretation
This chart provides a comparative benchmark of AI model capabilities in mathematics. The data suggests that while larger or specialized models (like InternLM2-Math-7B) generally achieve higher accuracy, their performance is not uniformly superior. The significant volatility in some models indicates potential brittleness—they may excel at certain types of reasoning (e.g., geometry) but fail catastrophically at others (e.g., complex probability).
The near-universal failure on "Probability of compound events" highlights a specific, challenging area for current AI math reasoning. The stark difference between the blue and orange lines underscores the effectiveness of targeted mathematical training. For a user or developer, this chart is a tool for model selection: choosing the best model depends heavily on the specific mathematical domain of interest. It also identifies clear areas for future model improvement, particularly in probability and statistics topics where performance is inconsistent or poor across the board.