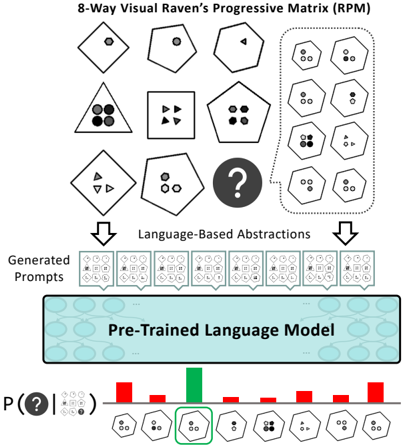
## Diagram: Visual Reasoning with Language Model
### Overview
The image illustrates a system for solving visual reasoning problems, specifically 8-Way Visual Raven's Progressive Matrix (RPM) problems, using a pre-trained language model. The system takes a visual matrix as input, generates language-based abstractions, and uses the language model to predict the missing element. The output is a probability distribution over possible answers.
### Components/Axes
* **Title:** 8-Way Visual Raven's Progressive Matrix (RPM)
* **Visual Matrix:** A 3x3 grid of images, with the bottom-right image replaced by a question mark. The images consist of geometric shapes with varying attributes (number of sides, number of internal objects, shading).
* **Language-Based Abstractions:** Text label indicating the conversion of visual information into a textual representation.
* **Generated Prompts:** A row of 8 images, each representing a textual prompt derived from the visual matrix. Each image contains a combination of shapes and symbols.
* **Pre-Trained Language Model:** A teal-colored block representing the language model, with a network diagram overlaid.
* **P(?|...)**: Label indicating the conditional probability of the missing element given the context.
* **Probability Distribution:** A bar chart showing the probability of each possible answer. The x-axis represents the 8 possible answer choices, depicted as geometric shapes. The y-axis represents probability, but no scale is provided. The bars are colored red, except for one green bar, indicating the most probable answer.
### Detailed Analysis
1. **Visual Matrix:**
* Row 1:
* Image 1: Diamond shape with a single gray circle inside.
* Image 2: Pentagon shape with a single gray circle inside.
* Image 3: Hexagon shape with a single gray triangle inside.
* Row 2:
* Image 4: Triangle shape with four circles inside (two gray, two dark).
* Image 5: Square shape with four dark triangles inside.
* Image 6: Pentagon shape with four gray circles inside.
* Row 3:
* Image 7: Diamond shape with three gray triangles inside.
* Image 8: Pentagon shape with three circles inside (two gray, one white).
* Image 9: Question mark inside a gray circle.
2. **Generated Prompts:** Eight images, each containing a combination of shapes and symbols. The shapes include circles, squares, diamonds, and triangles. The symbols are arranged in a 3x3 grid within each image.
3. **Probability Distribution:**
* The x-axis shows the 8 possible answer choices, each represented by a geometric shape.
* The y-axis represents the probability of each answer choice, but the scale is not provided.
* The bars are colored red, except for one green bar, indicating the most probable answer.
* The green bar corresponds to a hexagon shape with three circles inside (two white, one gray).
* The red bars have varying heights, indicating different probabilities for the other answer choices.
### Key Observations
* The system aims to solve visual reasoning problems by converting visual information into a textual representation and using a language model to predict the missing element.
* The probability distribution shows the confidence of the language model in each possible answer.
* The green bar indicates the most probable answer, as determined by the language model.
### Interpretation
The diagram illustrates a novel approach to solving visual reasoning problems by leveraging the power of pre-trained language models. The system bridges the gap between visual and textual information by generating language-based abstractions from the visual matrix. This allows the language model to reason about the visual relationships and predict the missing element. The probability distribution provides insights into the model's confidence in each possible answer. The green bar highlights the most probable answer, suggesting that the language model has successfully identified the correct solution. This approach has the potential to improve the performance of visual reasoning systems and enable new applications in areas such as image understanding and artificial intelligence.