\n
## Charts: Speedup vs. Instances/Layer Skip Ratio
### Overview
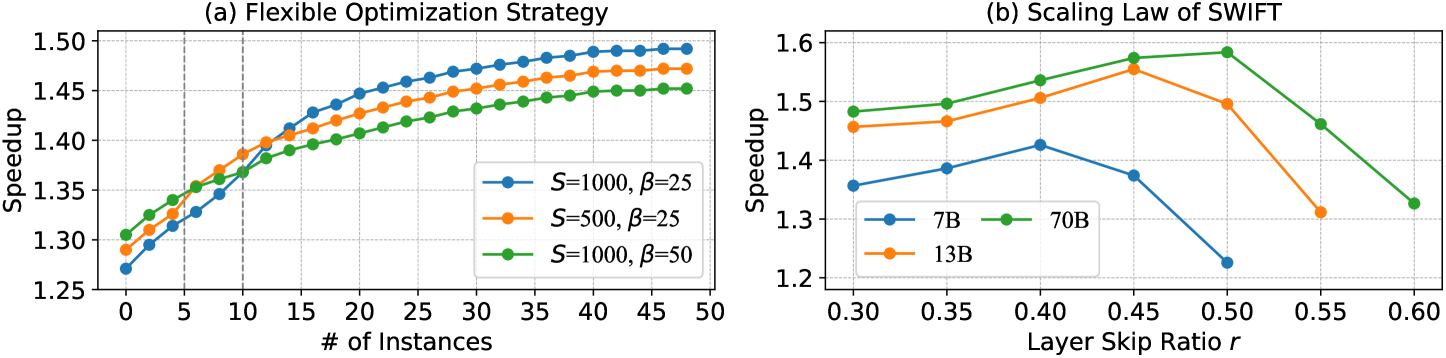
The image contains two charts, labeled (a) and (b). Chart (a) depicts the relationship between speedup and the number of instances for different optimization strategies. Chart (b) shows the speedup as a function of the layer skip ratio for different model sizes. Both charts aim to demonstrate performance scaling characteristics.
### Components/Axes
**Chart (a): Flexible Optimization Strategy**
* **X-axis:** "# of Instances" ranging from 0 to 50.
* **Y-axis:** "Speedup" ranging from 1.25 to 1.50.
* **Legend:**
* Blue Line: "S=1000, β=25"
* Orange Line: "S=500, β=25"
* Green Line: "S=1000, β=50"
**Chart (b): Scaling Law of SWIFT**
* **X-axis:** "Layer Skip Ratio r" ranging from 0.30 to 0.60.
* **Y-axis:** "Speedup" ranging from 1.2 to 1.6.
* **Legend:**
* Blue Line: "7B"
* Orange Line: "13B"
* Green Line: "70B"
### Detailed Analysis or Content Details
**Chart (a): Flexible Optimization Strategy**
* **Blue Line (S=1000, β=25):** The line slopes upward, showing increasing speedup with the number of instances.
* At 0 instances, speedup is approximately 1.28.
* At 5 instances, speedup is approximately 1.34.
* At 10 instances, speedup is approximately 1.38.
* At 15 instances, speedup is approximately 1.41.
* At 20 instances, speedup is approximately 1.43.
* At 25 instances, speedup is approximately 1.45.
* At 30 instances, speedup is approximately 1.46.
* At 35 instances, speedup is approximately 1.47.
* At 40 instances, speedup is approximately 1.48.
* At 45 instances, speedup is approximately 1.49.
* At 50 instances, speedup is approximately 1.50.
* **Orange Line (S=500, β=25):** The line also slopes upward, but at a slower rate than the blue line.
* At 0 instances, speedup is approximately 1.27.
* At 5 instances, speedup is approximately 1.32.
* At 10 instances, speedup is approximately 1.36.
* At 15 instances, speedup is approximately 1.39.
* At 20 instances, speedup is approximately 1.41.
* At 25 instances, speedup is approximately 1.43.
* At 30 instances, speedup is approximately 1.44.
* At 35 instances, speedup is approximately 1.45.
* At 40 instances, speedup is approximately 1.46.
* At 45 instances, speedup is approximately 1.47.
* At 50 instances, speedup is approximately 1.48.
* **Green Line (S=1000, β=50):** The line slopes upward, similar to the orange line, but generally higher than the orange line.
* At 0 instances, speedup is approximately 1.30.
* At 5 instances, speedup is approximately 1.36.
* At 10 instances, speedup is approximately 1.40.
* At 15 instances, speedup is approximately 1.43.
* At 20 instances, speedup is approximately 1.45.
* At 25 instances, speedup is approximately 1.46.
* At 30 instances, speedup is approximately 1.47.
* At 35 instances, speedup is approximately 1.48.
* At 40 instances, speedup is approximately 1.49.
* At 45 instances, speedup is approximately 1.50.
* At 50 instances, speedup is approximately 1.50.
**Chart (b): Scaling Law of SWIFT**
* **Blue Line (7B):** The line initially decreases, then plateaus.
* At 0.30, speedup is approximately 1.42.
* At 0.40, speedup is approximately 1.38.
* At 0.50, speedup is approximately 1.32.
* At 0.60, speedup is approximately 1.28.
* **Orange Line (13B):** The line increases initially, reaches a peak, and then decreases.
* At 0.30, speedup is approximately 1.40.
* At 0.40, speedup is approximately 1.46.
* At 0.50, speedup is approximately 1.52.
* At 0.60, speedup is approximately 1.44.
* **Green Line (70B):** The line increases steadily and then decreases.
* At 0.30, speedup is approximately 1.45.
* At 0.40, speedup is approximately 1.50.
* At 0.50, speedup is approximately 1.56.
* At 0.60, speedup is approximately 1.50.
### Key Observations
* In Chart (a), increasing the number of instances consistently improves speedup for all configurations. Higher values of S (1000) generally yield higher speedup than lower values (500). Higher values of β (50) also tend to improve speedup.
* In Chart (b), the 7B model shows a decreasing speedup with increasing layer skip ratio. The 13B model exhibits an optimal layer skip ratio around 0.50, while the 70B model shows a peak speedup around 0.50, followed by a decrease.
### Interpretation
Chart (a) demonstrates the benefits of distributed computing. Increasing the number of instances leads to a near-linear speedup, suggesting efficient parallelization. The parameters S and β likely control aspects of the optimization strategy, with higher S and β values leading to better performance.
Chart (b) illustrates the trade-offs involved in layer skipping. For smaller models (7B), skipping layers degrades performance. However, for larger models (13B and 70B), a moderate amount of layer skipping can improve speedup, likely by reducing computational cost. The optimal layer skip ratio depends on the model size, suggesting that larger models can benefit more from skipping layers. The decrease in speedup at higher layer skip ratios indicates that excessive skipping can lead to information loss and reduced accuracy. These charts provide insights into optimizing model training and inference by tuning the number of instances and layer skip ratio.