## Line Charts: Flexible Optimization Strategy and Scaling Law of SWIFT
### Overview
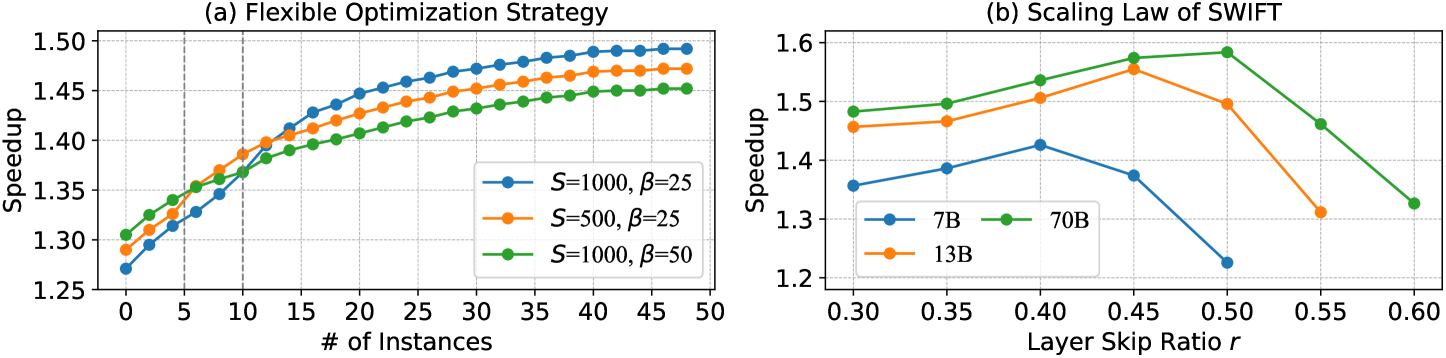
The image contains two line charts comparing performance metrics across different configurations. Chart (a) examines speedup against the number of instances under varying optimization strategies, while chart (b) analyzes speedup relative to layer skip ratios for different model sizes. Both charts use circular markers and include legends for data series identification.
### Components/Axes
**Chart (a): Flexible Optimization Strategy**
- **X-axis**: "# of Instances" (0 to 50, linear scale)
- **Y-axis**: "Speedup" (1.25 to 1.50, linear scale)
- **Legend**: Bottom-right corner
- Blue circles: S=1000, β=25
- Orange circles: S=500, β=25
- Green circles: S=1000, β=50
**Chart (b): Scaling Law of SWIFT**
- **X-axis**: "Layer Skip Ratio r" (0.30 to 0.60, linear scale)
- **Y-axis**: "Speedup" (1.2 to 1.6, linear scale)
- **Legend**: Bottom-right corner
- Blue circles: 7B
- Green circles: 70B
- Orange circles: 13B
### Detailed Analysis
**Chart (a) Trends**
1. **Blue (S=1000, β=25)**: Speedup increases steadily from ~1.28 (0 instances) to ~1.49 (50 instances). Notable points:
- 10 instances: ~1.38
- 25 instances: ~1.45
- 40 instances: ~1.48
2. **Orange (S=500, β=25)**: Similar upward trend but slightly lower values:
- 10 instances: ~1.37
- 25 instances: ~1.44
- 40 instances: ~1.47
3. **Green (S=1000, β=50)**: Parallel trajectory with marginally lower speedup:
- 10 instances: ~1.36
- 25 instances: ~1.43
- 40 instances: ~1.46
**Chart (b) Trends**
1. **Blue (7B)**:
- Peaks at r=0.40 (~1.42)
- Drops sharply after r=0.45 (~1.25 at r=0.50)
2. **Green (70B)**:
- Peaks at r=0.45 (~1.58)
- Declines gradually after r=0.50 (~1.45 at r=0.55)
3. **Orange (13B)**:
- Peaks at r=0.45 (~1.52)
- Steeper decline post-r=0.45 (~1.30 at r=0.55)
### Key Observations
1. **Chart (a)**: All configurations show linear speedup growth with increasing instances. Higher β (50 vs 25) correlates with ~0.02 lower speedup at 50 instances.
2. **Chart (b)**:
- Larger models (70B) achieve higher peak speedup but exhibit sharper declines post-optimal r.
- 7B model's performance drops ~17% after r=0.40, while 13B drops ~14%.
- Optimal r values vary by model size: 7B (r=0.40), 13B/70B (r=0.45).
### Interpretation
- **Chart (a)** suggests that optimization strategy (S, β) impacts scalability, with higher β reducing efficiency gains at scale.
- **Chart (b)** reveals an inverse relationship between model size and optimal layer skip ratio effectiveness. Larger models (70B) require precise r tuning to avoid performance degradation, while smaller models (7B) show more abrupt declines.
- The 70B model's peak speedup (~1.58) exceeds others by 12-15%, but its sensitivity to r increases with size. This implies architectural tradeoffs between model capacity and computational efficiency in SWIFT's scaling law.