## Pie Charts: Distribution by Year
### Overview
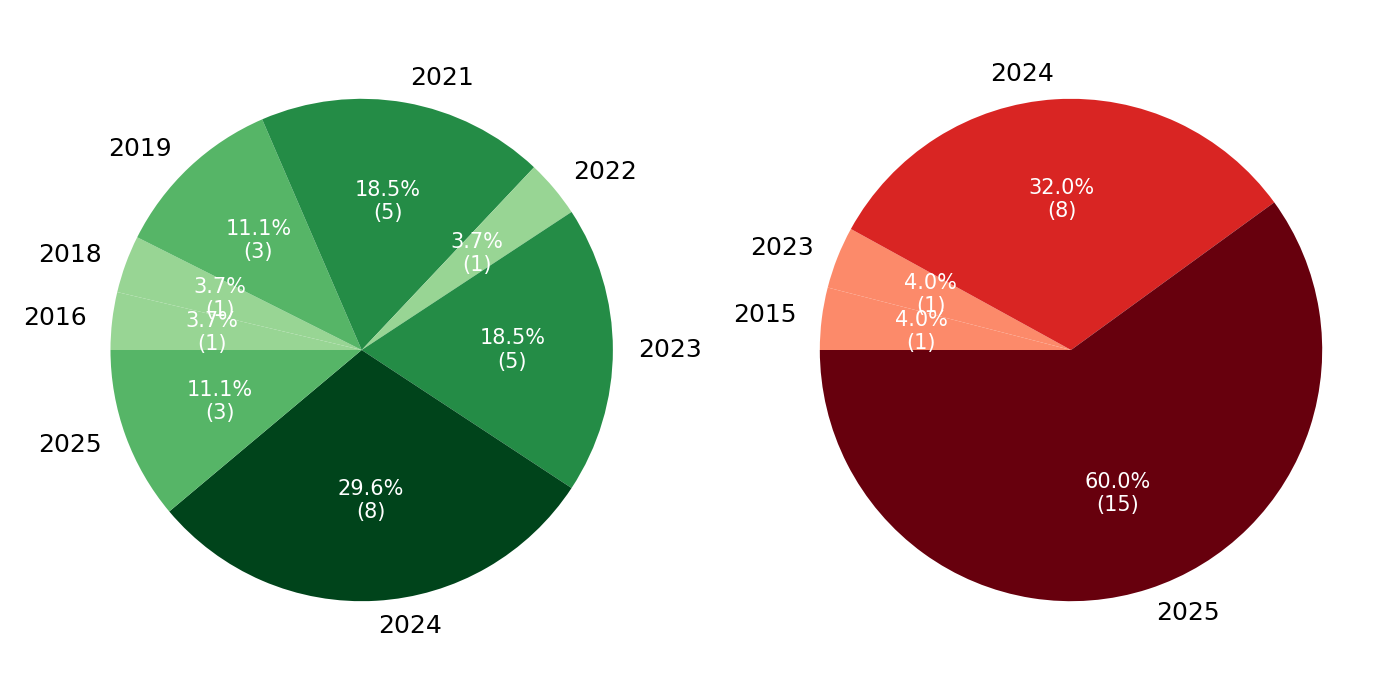
The image contains two pie charts, each representing a distribution across different years. The left pie chart uses shades of green, while the right pie chart uses shades of red. Each slice of the pie chart is labeled with a year, a percentage, and a number in parentheses.
### Components/Axes
* **Pie Charts:** Two pie charts, one on the left and one on the right.
* **Labels:** Each slice is labeled with a year (2015, 2016, 2018, 2019, 2021, 2022, 2023, 2024, 2025), a percentage value, and a number in parentheses.
* **Colors:** The left pie chart uses shades of green, and the right pie chart uses shades of red.
### Detailed Analysis
**Left Pie Chart (Green Shades):**
* **2016:** 3.7% (1), light green
* **2018:** 3.7% (1), light green
* **2019:** 11.1% (3), medium green
* **2021:** 18.5% (5), medium green
* **2022:** 3.7% (1), light green
* **2023:** 18.5% (5), medium green
* **2024:** 29.6% (8), dark green
* **2025:** 11.1% (3), medium green
**Right Pie Chart (Red Shades):**
* **2015:** 4.0% (1), light red
* **2023:** 4.0% (1), light red
* **2024:** 32.0% (8), medium red
* **2025:** 60.0% (15), dark red
### Key Observations
* In the left pie chart, 2024 has the largest percentage (29.6%), followed by 2021 and 2023 (both at 18.5%).
* In the right pie chart, 2025 has the largest percentage (60.0%), followed by 2024 (32.0%).
* The years 2015, 2016, 2018, 2019, 2021, and 2022 only appear in the left pie chart.
### Interpretation
The