## Scatter Plot: LLM Benchmark Performance vs. Parameter Size
### Overview
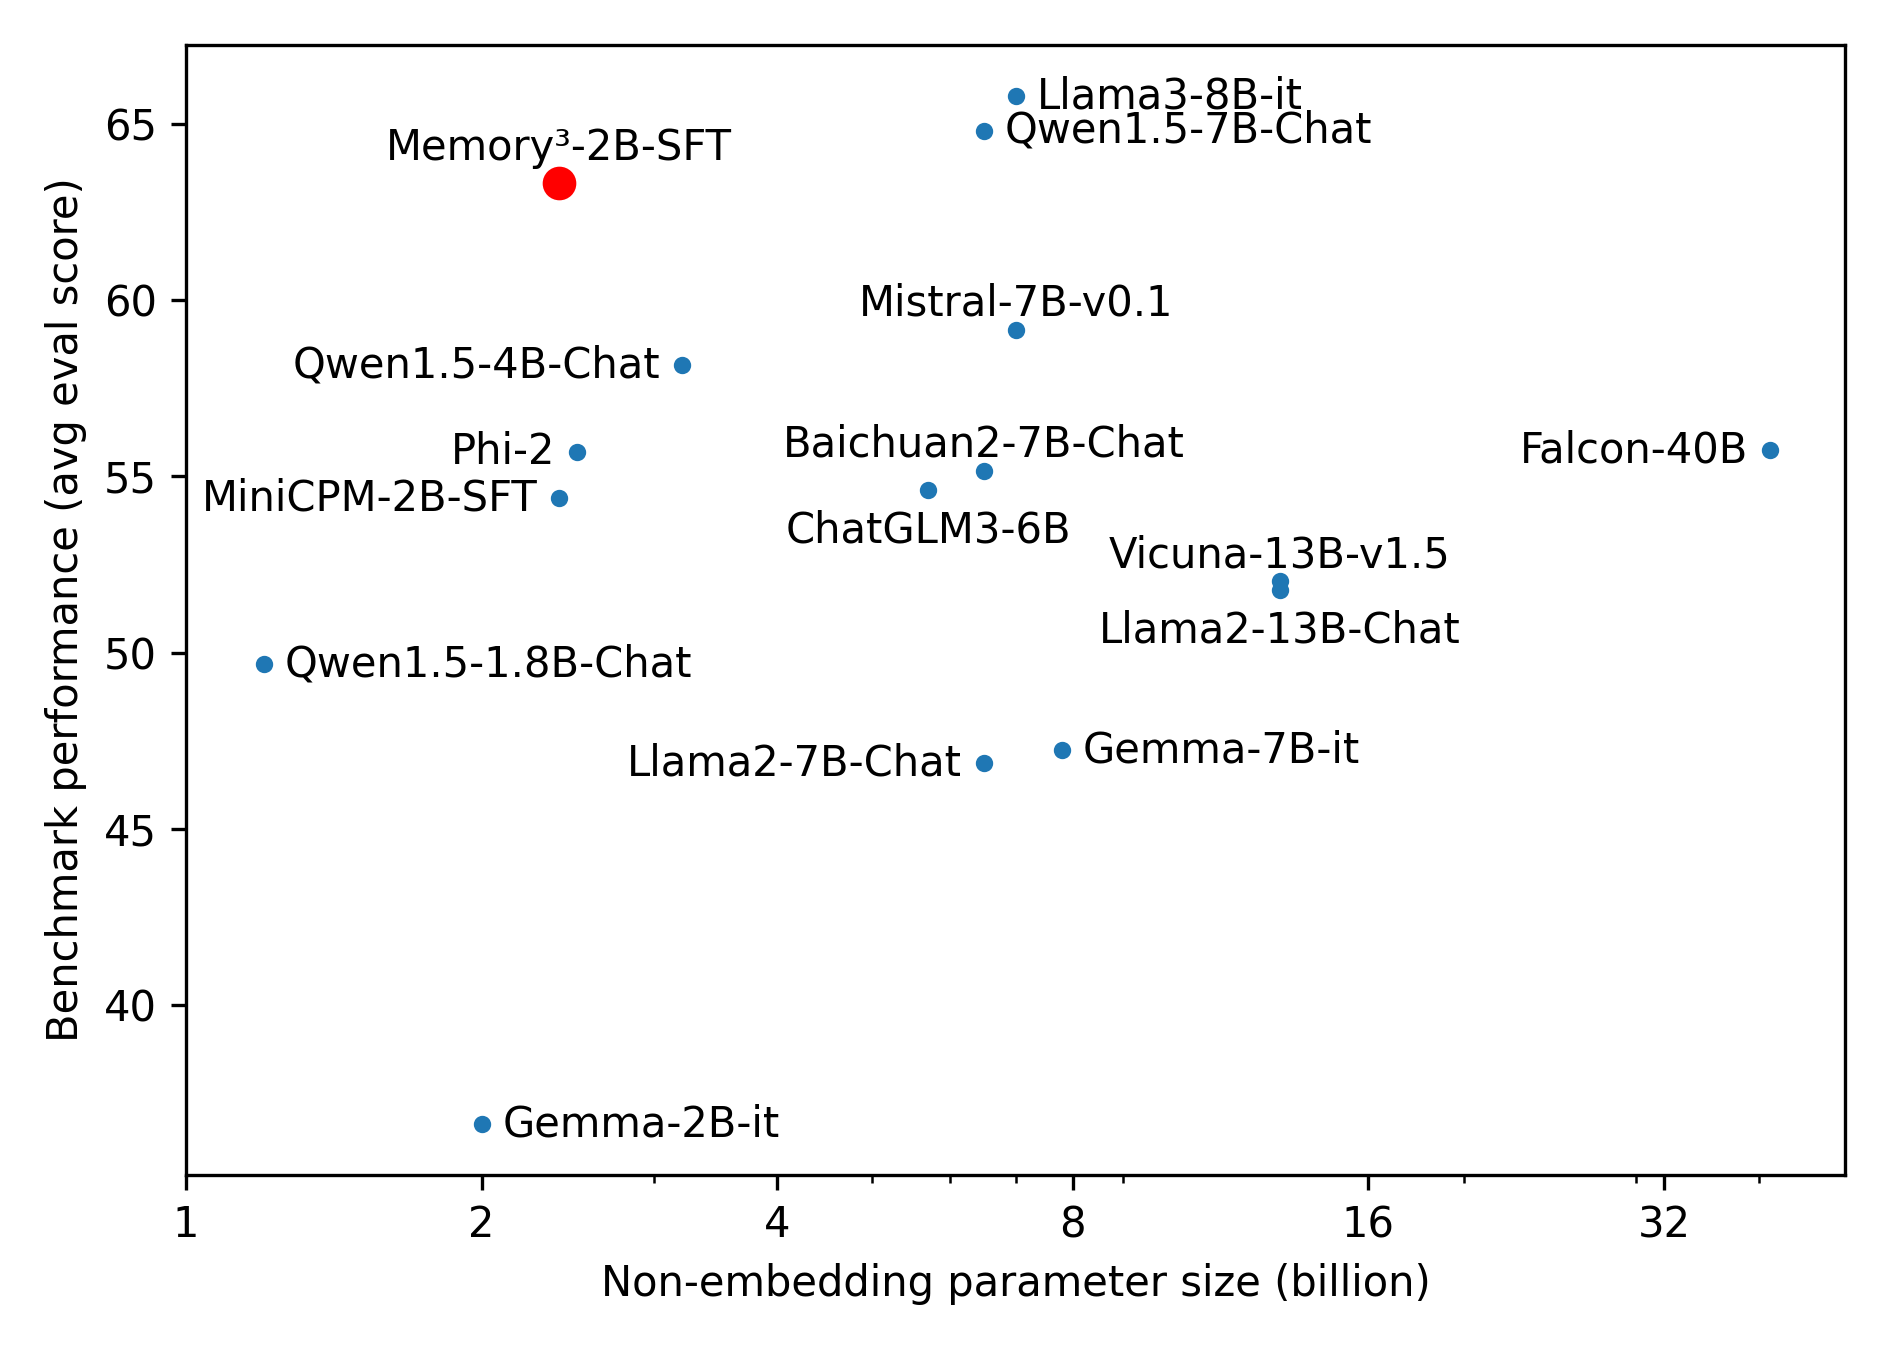
This image is a scatter plot comparing various Large Language Models (LLMs). It plots the non-embedding parameter size of each model against its average evaluation score on benchmarks. The chart is designed to highlight the efficiency and performance of a specific model, "Memory³-2B-SFT", which is distinguished by a red marker, contrasting with the blue markers used for all other models.
### Components/Axes
**1. X-Axis (Bottom):**
* **Label:** "Non-embedding parameter size (billion)"
* **Scale:** Logarithmic (base 2).
* **Major Markers:** 1, 2, 4, 8, 16, 32.
* **Minor Markers:** Tick marks exist between the major numbers to denote intermediate values on the log scale.
**2. Y-Axis (Left):**
* **Label:** "Benchmark performance (avg eval score)"
* **Scale:** Linear.
* **Markers:** 40, 45, 50, 55, 60, 65.
**3. Legend/Color Coding (Implicit):**
* **Red Dot:** Represents the focal model of the chart ("Memory³-2B-SFT").
* **Blue Dots:** Represent all other baseline/competitor models.
### Detailed Analysis
**Visual Trend Verification:**
The overall visual trend shows a loose, positive correlation: as parameter size increases (moving right on the x-axis), benchmark performance generally tends to increase (moving up on the y-axis). However, there is significant vertical variance at any given parameter size (especially around the 7B-8B mark), indicating that parameter count is not the sole determinant of performance. The red dot breaks the general trend by achieving top-tier performance at a very low parameter count.
**Data Point Extraction:**
*(Note: Values are approximate visual estimates based on the linear Y-axis and logarithmic X-axis).*
* **The Highlighted Model (Red Dot, Top-Left quadrant):**
* **Memory³-2B-SFT:** X ≈ 2.5B, Y ≈ 63.5
* **Sub-4 Billion Parameter Models (Blue Dots, Left side):**
* **Qwen1.5-1.8B-Chat:** X ≈ 1.8B, Y ≈ 49.8
* **Gemma-2B-it:** X ≈ 2.0B, Y ≈ 36.6 (Lowest overall performance)
* **MiniCPM-2B-SFT:** X ≈ 2.5B, Y ≈ 54.5
* **Phi-2:** X ≈ 2.8B, Y ≈ 55.8
* **Qwen1.5-4B-Chat:** X ≈ 4.0B, Y ≈ 58.2
* **6 to 8 Billion Parameter Models (Blue Dots, Center column):**
* **ChatGLM3-6B:** X ≈ 6.0B, Y ≈ 54.6
* **Llama2-7B-Chat:** X ≈ 7.0B, Y ≈ 46.9
* **Gemma-7B-it:** X ≈ 7.0B, Y ≈ 47.2
* **Baichuan2-7B-Chat:** X ≈ 7.0B, Y ≈ 55.2
* **Mistral-7B-v0.1:** X ≈ 7.0B, Y ≈ 59.2
* **Qwen1.5-7B-Chat:** X ≈ 7.0B, Y ≈ 64.8
* **Llama3-8B-it:** X ≈ 8.0B, Y ≈ 65.8 (Highest overall performance)
* **13+ Billion Parameter Models (Blue Dots, Right side):**
* **Llama2-13B-Chat:** X ≈ 13.0B, Y ≈ 51.8
* **Vicuna-13B-v1.5:** X ≈ 13.0B, Y ≈ 52.0
* **Falcon-40B:** X ≈ 40.0B, Y ≈ 55.8 (Largest model shown)
### Key Observations
1. **The Outlier:** "Memory³-2B-SFT" is a significant outlier. Despite having roughly 2.5 billion parameters, it scores higher (~63.5) than almost every other model on the chart, including models 5 to 16 times its size (like Llama2-13B and Falcon-40B).
2. **Highest Absolute Performer:** "Llama3-8B-it" holds the highest benchmark score (~65.8) on this chart, closely followed by "Qwen1.5-7B-Chat".
3. **Generational Leaps:** There is a massive performance gap between older and newer models of similar sizes. For example, Llama3-8B-it (~65.8) vastly outperforms Llama2-7B-Chat (~46.9).
4. **Diminishing Returns of Size:** "Falcon-40B", despite being the largest model by a wide margin (far right), only achieves a middling score of ~55.8, being outperformed by several 7B and even 2B models.
### Interpretation
This chart is designed to serve as a compelling marketing or research validation asset for the **Memory³-2B-SFT** model.
By plotting performance against parameter size (which directly correlates to computational cost, memory requirements, and inference speed), the chart demonstrates a concept of "punching above its weight class."
**Peircean Investigative Reading:**
* *Observation:* Memory³-2B-SFT achieves a score of ~63.5 with only ~2.5B parameters, while Falcon-40B achieves ~55.8 with 40B parameters.
* *Rule:* Historically, scaling laws dictated that more parameters equaled better performance (evident in the older Llama2 and Falcon models).
* *Hypothesis/Meaning:* The data suggests a paradigm shift in LLM development. Raw parameter count is no longer the primary driver of benchmark success. The chart implies that the architecture, training data quality, or specific fine-tuning methods (noted by "SFT" - Supervised Fine-Tuning) used in Memory³-2B-SFT are highly optimized.
The chart effectively communicates to developers and researchers that they do not need massive, expensive hardware to achieve state-of-the-art performance; they can use a highly efficient, smaller model like Memory³-2B-SFT to achieve results comparable to the best 7B-8B models (like Llama 3 and Qwen 1.5) and vastly superior to older, massive models.