## Scatter Plot: Benchmark Performance vs. Non-Embedding Parameter Size
### Overview
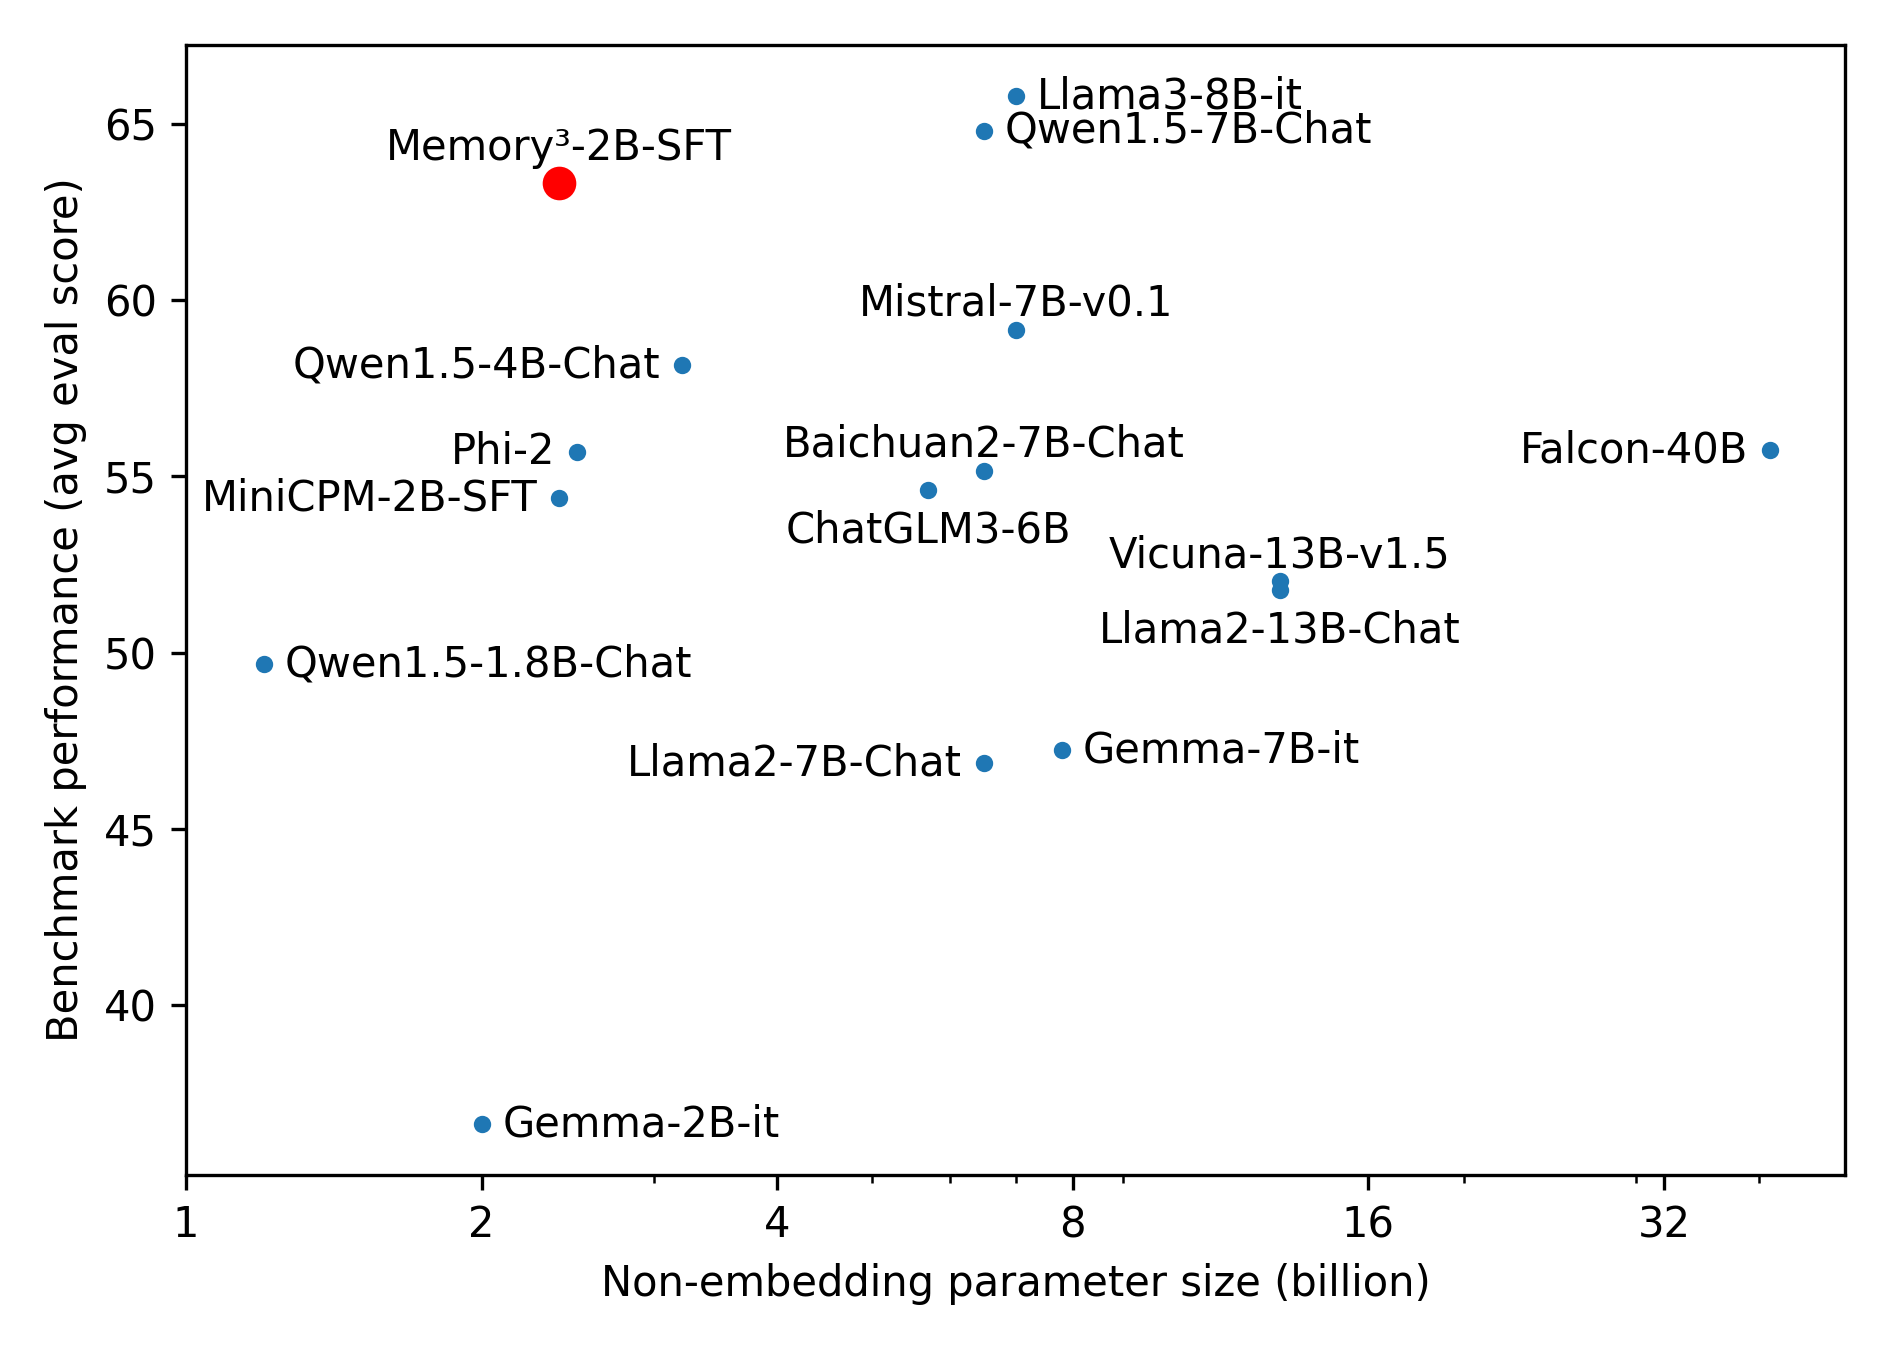
The image is a scatter plot comparing the benchmark performance (average evaluation score) of various language models against their non-embedding parameter size (in billions). Each data point represents a different model, labeled with its name. The plot visually represents the relationship between model size and performance.
### Components/Axes
* **X-axis:** Non-embedding parameter size (billion). The scale is logarithmic, with marked values at 1, 2, 4, 8, 16, and 32.
* **Y-axis:** Benchmark performance (avg eval score). The scale is linear, ranging from 40 to 65, with tick marks at intervals of 5.
* **Data Points:** Each model is represented by a dot, with its name displayed nearby. Most dots are blue, but one is red.
* **Labels:** Model names are placed near their corresponding data points.
### Detailed Analysis
* **Data Points and Values:**
* **Memory³-2B-SFT:** (Red dot) Located at approximately x=2, y=63.
* **Qwen1.5-4B-Chat:** (Blue dot) Located at approximately x=2.5, y=57.
* **Phi-2:** (Blue dot) Located at approximately x=2.5, y=55.
* **MiniCPM-2B-SFT:** (Blue dot) Located at approximately x=2.5, y=55.
* **Qwen1.5-1.8B-Chat:** (Blue dot) Located at approximately x=1.5, y=50.
* **Gemma-2B-it:** (Blue dot) Located at approximately x=2, y=37.
* **Llama2-7B-Chat:** (Blue dot) Located at approximately x=4, y=47.
* **Gemma-7B-it:** (Blue dot) Located at approximately x=8, y=47.
* **Llama3-8B-it:** (Blue dot) Located at approximately x=6, y=65.
* **Qwen1.5-7B-Chat:** (Blue dot) Located at approximately x=6, y=64.
* **Mistral-7B-v0.1:** (Blue dot) Located at approximately x=6, y=60.
* **Baichuan2-7B-Chat:** (Blue dot) Located at approximately x=5, y=56.
* **ChatGLM3-6B:** (Blue dot) Located at approximately x=5, y=53.
* **Vicuna-13B-v1.5:** (Blue dot) Located at approximately x=12, y=52.
* **Llama2-13B-Chat:** (Blue dot) Located at approximately x=12, y=51.
* **Falcon-40B:** (Blue dot) Located at approximately x=32, y=56.
* **Trends:**
* Generally, there is a positive correlation between the non-embedding parameter size and benchmark performance. Larger models tend to perform better.
* However, there are exceptions, indicating that model architecture and training data also play significant roles.
### Key Observations
* **Outlier:** Memory³-2B-SFT (red dot) shows a relatively high benchmark performance for its parameter size, suggesting it might be more efficient or specialized.
* **Performance Plateau:** The performance seems to plateau for models with parameter sizes greater than 16 billion.
* **Model Clustering:** Several models with similar parameter sizes (around 7B) exhibit varying performance, highlighting the impact of architectural differences.
### Interpretation
The scatter plot illustrates the relationship between model size and performance for a selection of language models. The general trend suggests that increasing the number of parameters tends to improve performance. However, the presence of outliers and variations among models with similar sizes indicates that other factors, such as model architecture, training data quality, and optimization techniques, also significantly influence benchmark performance. The red data point, Memory³-2B-SFT, stands out as a potentially more efficient model, achieving a high score with a relatively small parameter size. The plateauing of performance for larger models suggests diminishing returns in simply scaling up the parameter count.