## Chart: Mistral-7B-v0.3-Chat Loss vs. Epoch
### Overview
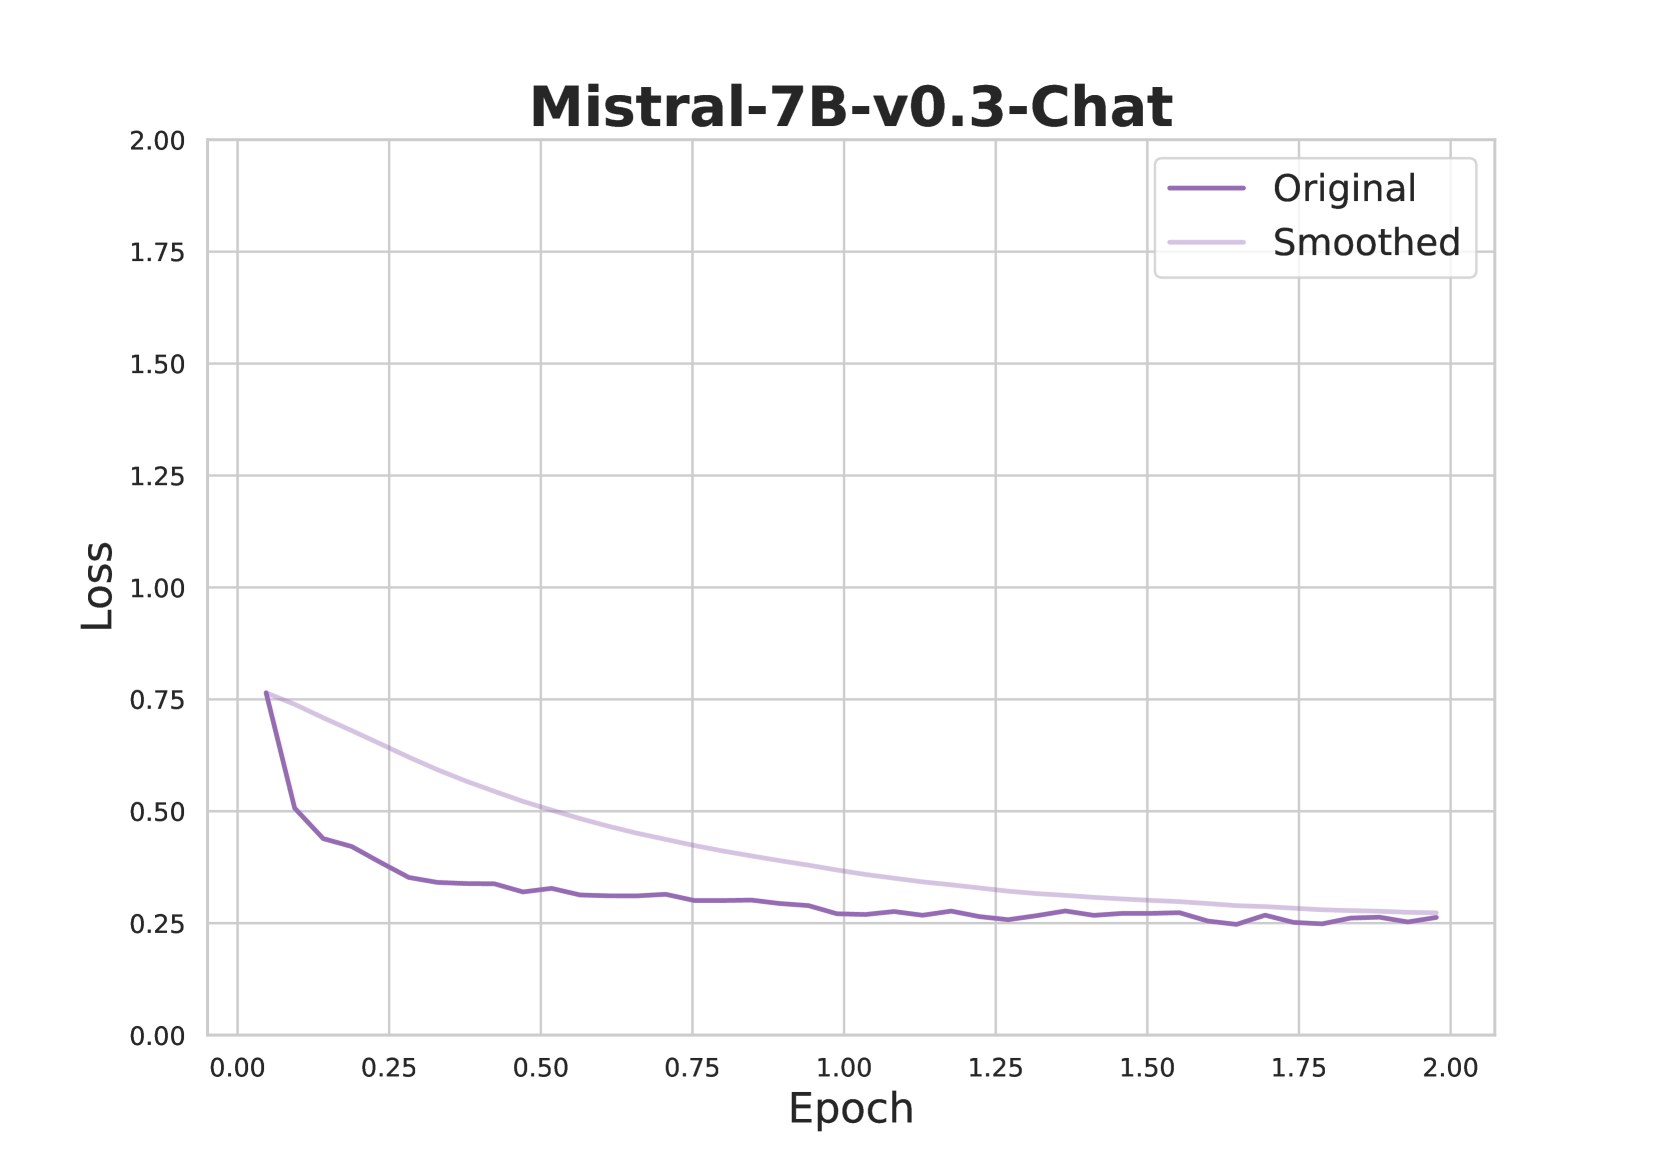
The image is a line chart displaying the loss of the Mistral-7B-v0.3-Chat model during training, plotted against the number of epochs. Two lines are shown: the "Original" loss and a "Smoothed" version of the loss. The chart illustrates how the loss decreases over time as the model learns.
### Components/Axes
* **Title:** Mistral-7B-v0.3-Chat
* **X-axis:** Epoch, ranging from 0.00 to 2.00 in increments of 0.25.
* **Y-axis:** Loss, ranging from 0.00 to 2.00 in increments of 0.25.
* **Legend:** Located in the top-right corner.
* "Original": Represented by a dark purple line.
* "Smoothed": Represented by a light purple line.
### Detailed Analysis
* **Original Loss (Dark Purple):**
* The line starts at approximately 0.77 loss at epoch 0.00.
* It rapidly decreases to approximately 0.50 by epoch 0.125.
* The line continues to decrease, but at a slower rate, reaching approximately 0.33 by epoch 0.5.
* The line fluctuates slightly around 0.30 between epochs 0.5 and 1.5.
* The line stabilizes around 0.27 between epochs 1.75 and 2.00.
* **Smoothed Loss (Light Purple):**
* The line starts at approximately 0.77 loss at epoch 0.00.
* It decreases steadily, but more gradually than the original loss, reaching approximately 0.50 by epoch 0.5.
* The line continues to decrease, reaching approximately 0.35 by epoch 1.25.
* The line stabilizes around 0.27 between epochs 1.75 and 2.00.
### Key Observations
* The "Original" loss exhibits more fluctuation than the "Smoothed" loss.
* Both lines show a significant decrease in loss during the initial epochs, indicating rapid learning.
* The rate of loss reduction decreases over time, suggesting diminishing returns as training progresses.
* The "Smoothed" loss provides a clearer view of the overall trend by reducing noise.
### Interpretation
The chart demonstrates the training progress of the Mistral-7B-v0.3-Chat model. The decreasing loss indicates that the model is learning and improving its performance over time. The "Smoothed" loss curve helps to visualize the underlying trend by filtering out short-term fluctuations in the "Original" loss. The convergence of both lines towards the end of the training suggests that the model is approaching a stable state. The initial rapid decrease in loss followed by a slower decrease is a common pattern in machine learning, reflecting the model's initial rapid learning followed by more incremental improvements.