\n
## Line Chart: Mistral-7B-v0.3-Chat Loss vs. Epoch
### Overview
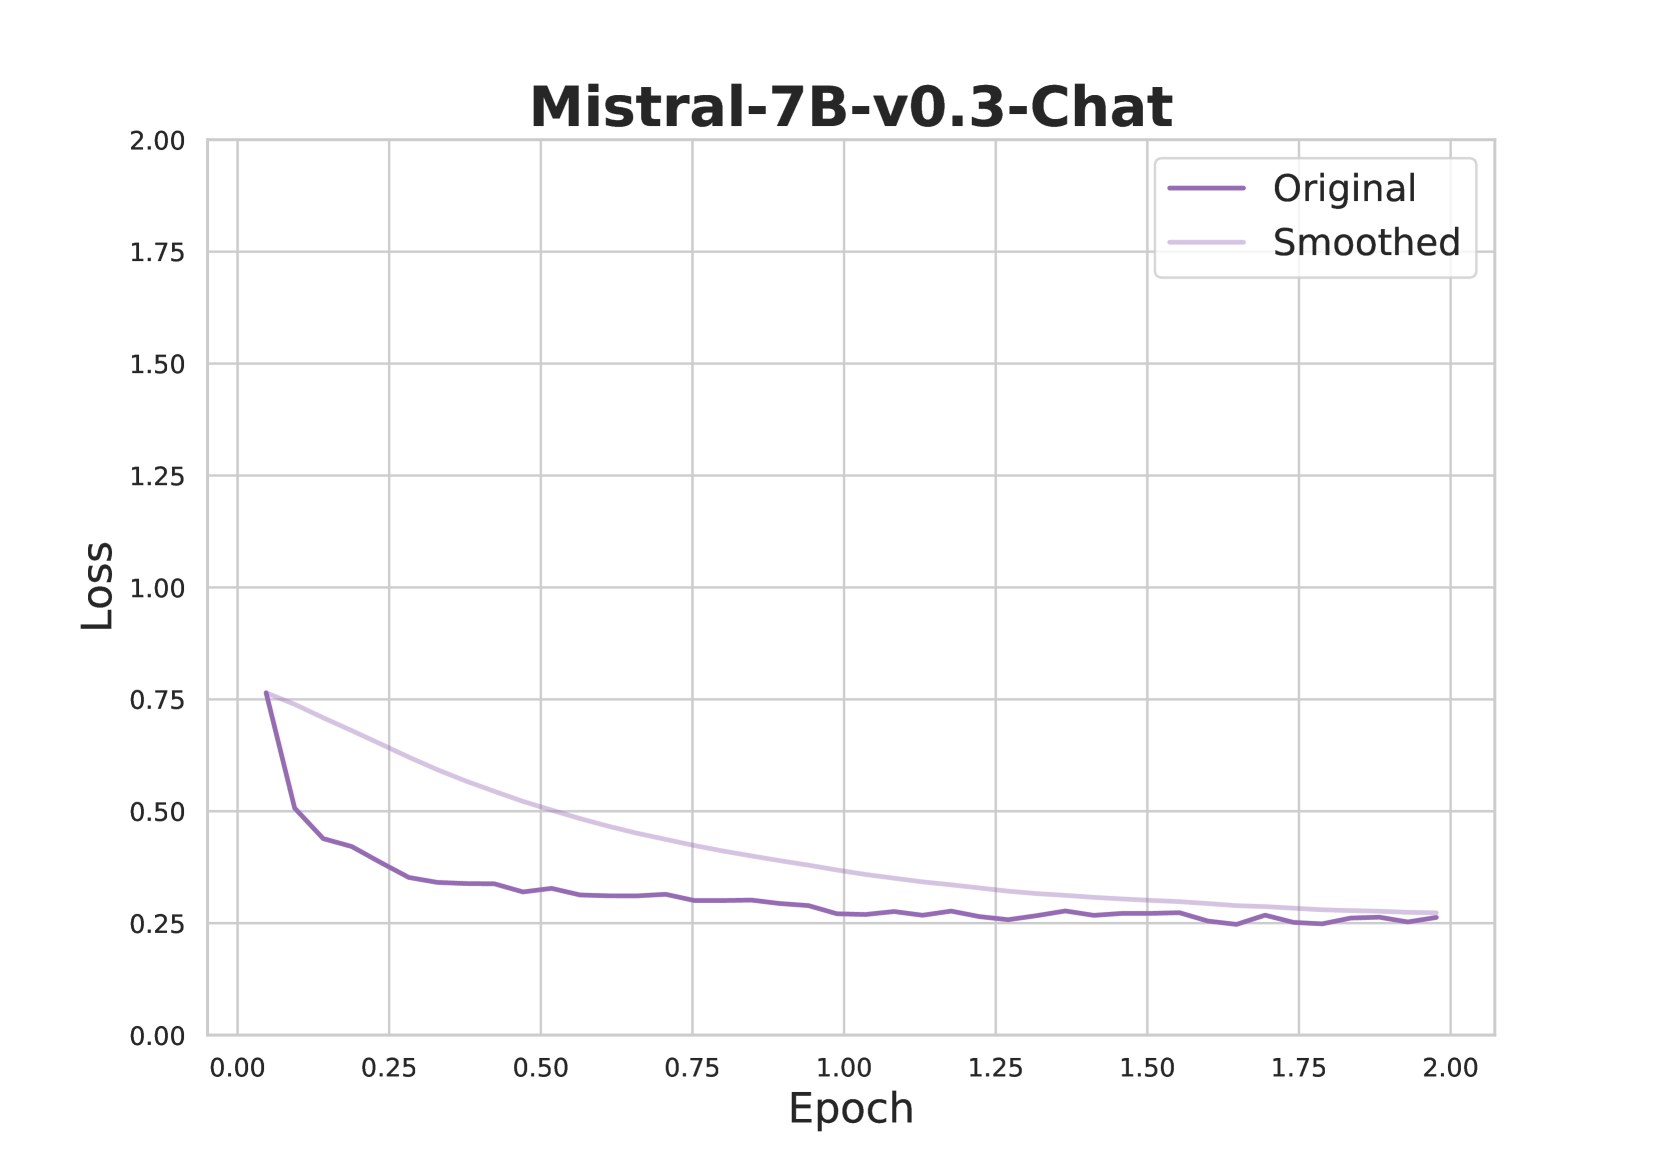
This image presents a line chart illustrating the relationship between 'Loss' and 'Epoch' for a model named "Mistral-7B-v0.3-Chat". Two lines are plotted: one representing the 'Original' loss and the other representing the 'Smoothed' loss. The chart appears to track the model's training progress, showing how the loss function changes over epochs.
### Components/Axes
* **Title:** Mistral-7B-v0.3-Chat
* **X-axis:** Epoch (ranging from approximately 0.00 to 2.00)
* **Y-axis:** Loss (ranging from approximately 0.00 to 2.00)
* **Legend:**
* Original (Purple line)
* Smoothed (Gray line)
* **Gridlines:** A light gray grid is present, aiding in reading values.
### Detailed Analysis
The chart displays two lines representing loss over epochs.
**Original Line (Purple):**
The line starts at approximately 0.65 loss at Epoch 0.00. It exhibits a steep downward slope initially, decreasing to around 0.35 loss by Epoch 0.25. The slope then becomes less steep, leveling off around 0.25 loss between Epochs 0.50 and 2.00. There are minor fluctuations around this level.
Approximate data points:
* Epoch 0.00: Loss ≈ 0.65
* Epoch 0.25: Loss ≈ 0.35
* Epoch 0.50: Loss ≈ 0.28
* Epoch 1.00: Loss ≈ 0.25
* Epoch 1.50: Loss ≈ 0.24
* Epoch 2.00: Loss ≈ 0.26
**Smoothed Line (Gray):**
The smoothed line begins at approximately 0.75 loss at Epoch 0.00. It also shows a downward trend, but is less volatile than the original line. It reaches a minimum of around 0.22 loss at Epoch 1.00. After Epoch 1.00, the smoothed line fluctuates slightly around 0.23-0.25 loss.
Approximate data points:
* Epoch 0.00: Loss ≈ 0.75
* Epoch 0.25: Loss ≈ 0.50
* Epoch 0.50: Loss ≈ 0.35
* Epoch 1.00: Loss ≈ 0.22
* Epoch 1.50: Loss ≈ 0.24
* Epoch 2.00: Loss ≈ 0.25
### Key Observations
* Both the original and smoothed loss curves demonstrate a decreasing trend, indicating that the model is learning and improving over epochs.
* The smoothed line is less noisy than the original line, suggesting that it represents a more stable and generalized view of the loss function.
* The original loss appears to fluctuate more, potentially indicating overfitting or sensitivity to specific training batches.
* The loss values appear to converge towards a stable level around 0.25, suggesting that the model is approaching a point of diminishing returns in terms of further training.
### Interpretation
The chart illustrates the training process of the Mistral-7B-v0.3-Chat model. The decreasing loss values indicate successful learning. The difference between the original and smoothed loss curves suggests that the model's performance is somewhat variable during training, but the smoothing process provides a more robust representation of the overall trend. The convergence of the loss curves around 0.25 suggests that the model has reached a point where further training may not yield significant improvements. This could be a good indication to stop training and evaluate the model's performance on a validation dataset. The smoothing likely represents a moving average, reducing the impact of individual epoch variations and highlighting the overall learning trajectory. The fact that the smoothed line consistently remains above the original line suggests that the smoothing process is not masking any significant improvements, but rather providing a clearer view of the underlying trend.