# Technical Document Extraction: Model Accuracy vs. Budget
## Chart Type
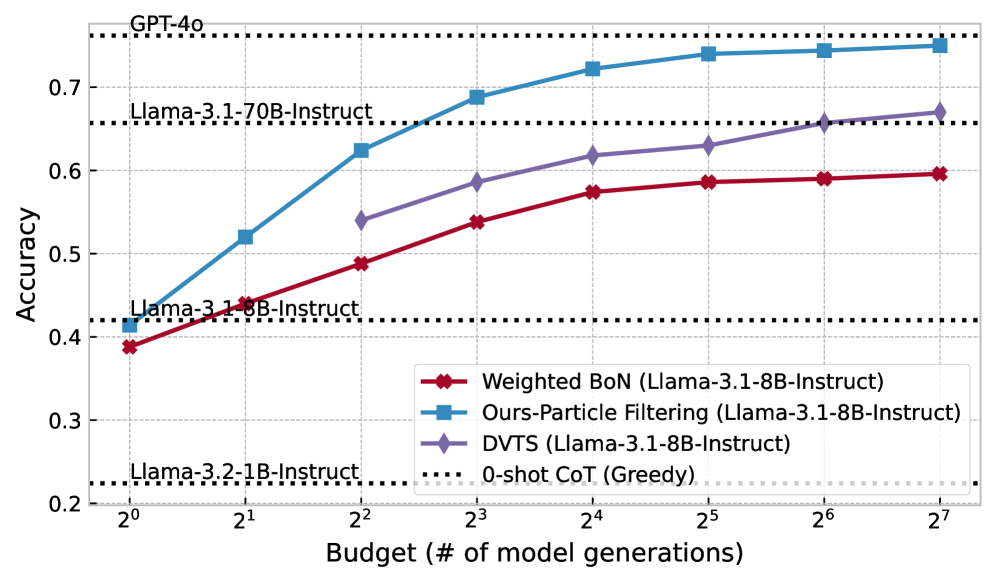
Line chart comparing model accuracy against computational budget (number of model generations).
---
### Axis Labels
- **X-axis**: `Budget (# of model generations)`
- Values: `2^0` to `2^7` (logarithmic scale)
- **Y-axis**: `Accuracy`
- Range: `0.2` to `0.7`
---
### Legend
- **Position**: Bottom-right quadrant
- **Entries**:
1. **Weighted BoN (Llama-3.1-8B-Instruct)**
- Color: Red (`#FF0000`)
- Marker: Diamond (`\u2666`)
2. **Ours-Particle Filtering (Llama-3.1-8B-Instruct)**
- Color: Blue (`#0000FF`)
- Marker: Square (`\u25a0`)
3. **DVTS (Llama-3.1-8B-Instruct)**
- Color: Purple (`#800080`)
- Marker: Diamond (`\u2666`)
4. **0-shot CoT (Greedy)**
- Color: Gray (`#808080`)
- Style: Dotted line (`\u2014`)
---
### Data Series & Trends
1. **Ours-Particle Filtering (Blue)**
- **Trend**: Steep upward slope, plateauing near `0.75`
- **Data Points**:
- `2^0`: `0.41`
- `2^1`: `0.52`
- `2^2`: `0.62`
- `2^3`: `0.68`
- `2^4`: `0.72`
- `2^5`: `0.74`
- `2^6`: `0.75`
- `2^7`: `0.76`
2. **DVTS (Purple)**
- **Trend**: Gradual upward slope, plateauing near `0.67`
- **Data Points**:
- `2^0`: `0.42`
- `2^1`: `0.54`
- `2^2`: `0.54`
- `2^3`: `0.58`
- `2^4`: `0.62`
- `2^5`: `0.63`
- `2^6`: `0.66`
- `2^7`: `0.67`
3. **Weighted BoN (Red)**
- **Trend**: Gradual upward slope, plateauing near `0.60`
- **Data Points**:
- `2^0`: `0.39`
- `2^1`: `0.43`
- `2^2`: `0.49`
- `2^3`: `0.54`
- `2^4`: `0.57`
- `2^5`: `0.59`
- `2^6`: `0.59`
- `2^7`: `0.60`
4. **0-shot CoT (Greedy) (Gray Dotted Line)**
- **Trend**: Flat line at `0.2`
---
### Key Observations
- **Performance Hierarchy**:
`Ours-Particle Filtering > DVTS > Weighted BoN > 0-shot CoT`
- **Scaling Efficiency**:
- `Ours-Particle Filtering` achieves `0.76` accuracy at `2^7` generations (128x budget of `2^0`).
- `Weighted BoN` requires `2^7` generations to reach `0.60` accuracy.
- **Baseline Comparison**:
`0-shot CoT` remains at `0.2` accuracy regardless of budget.
---
### Model Names in Legend
- **Llama-3.1-8B-Instruct**: Base model for all methods except `0-shot CoT`.
- **GPT-4o**: Reference model (dotted line at `0.7` accuracy).
---
### Spatial Grounding
- **Legend Position**: Bottom-right quadrant (aligned with data series).
- **Color Consistency**:
- Blue squares (`\u25a0`) match `Ours-Particle Filtering`.
- Red diamonds (`\u2666`) match `Weighted BoN`.
- Purple diamonds (`\u2666`) match `DVTS`.
- Gray dotted line matches `0-shot CoT`.
---
### Missing Information
- No additional text or data tables present.
- No non-English content detected.