\n
## Line Charts: Accuracy vs. Training/Test Data
### Overview
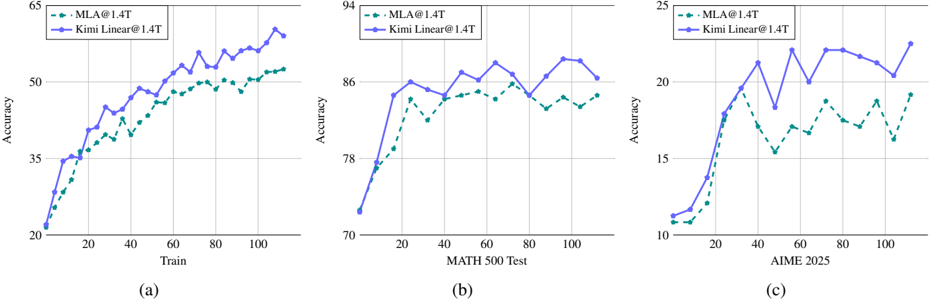
The image presents three separate line charts, labeled (a), (b), and (c). Each chart displays the accuracy of two models, "MLA@1.4T" and "Kimi Linear@1.4T", plotted against different input data. Chart (a) shows accuracy versus "Train" data, (b) shows accuracy versus "MATH 500 Test" data, and (c) shows accuracy versus "AIME 2025" data. All charts share a common y-axis representing "Accuracy".
### Components/Axes
* **Y-axis (all charts):** "Accuracy", ranging from approximately 10 to 95.
* **Chart (a):**
* **X-axis:** "Train", ranging from 0 to 100.
* **Line 1 (Purple):** "MLA@1.4T"
* **Line 2 (Green):** "Kimi Linear@1.4T"
* **Chart (b):**
* **X-axis:** "MATH 500 Test", ranging from 0 to 100.
* **Line 1 (Purple):** "MLA@1.4T"
* **Line 2 (Green):** "Kimi Linear@1.4T"
* **Chart (c):**
* **X-axis:** "AIME 2025", ranging from 0 to 100.
* **Line 1 (Purple):** "MLA@1.4T"
* **Line 2 (Green):** "Kimi Linear@1.4T"
### Detailed Analysis
**Chart (a): Accuracy vs. Train**
* **MLA@1.4T (Purple):** The line starts at approximately 21 at x=0, increases steadily to around 55 at x=60, then continues to increase, reaching approximately 63 at x=100. The line exhibits some fluctuations.
* **Kimi Linear@1.4T (Green):** The line begins at approximately 22 at x=0, rises to around 45 at x=40, then fluctuates, reaching a peak of approximately 53 at x=80, and ends at approximately 51 at x=100.
**Chart (b): Accuracy vs. MATH 500 Test**
* **MLA@1.4T (Purple):** The line starts at approximately 72 at x=0, rises sharply to around 86 at x=40, then fluctuates, reaching a peak of approximately 91 at x=60, and ends at approximately 88 at x=100.
* **Kimi Linear@1.4T (Green):** The line begins at approximately 74 at x=0, rises to around 84 at x=40, then fluctuates, reaching a peak of approximately 87 at x=80, and ends at approximately 85 at x=100.
**Chart (c): Accuracy vs. AIME 2025**
* **MLA@1.4T (Purple):** The line starts at approximately 11 at x=0, rises sharply to around 23 at x=40, then fluctuates, reaching a peak of approximately 24 at x=60, and ends at approximately 23 at x=100.
* **Kimi Linear@1.4T (Green):** The line begins at approximately 12 at x=0, rises to around 18 at x=40, then fluctuates, reaching a peak of approximately 21 at x=80, and ends at approximately 19 at x=100.
### Key Observations
* In all three charts, "MLA@1.4T" generally achieves higher accuracy than "Kimi Linear@1.4T".
* The "MATH 500 Test" chart shows the highest overall accuracy levels for both models.
* The "AIME 2025" chart shows the lowest overall accuracy levels for both models.
* All lines exhibit fluctuations, suggesting sensitivity to the specific data points used for evaluation.
### Interpretation
The data suggests that the "MLA@1.4T" model consistently outperforms the "Kimi Linear@1.4T" model across all three datasets ("Train", "MATH 500 Test", and "AIME 2025"). The significant difference in accuracy between the datasets indicates that the models perform better on the "MATH 500 Test" data than on the "AIME 2025" data, potentially due to differences in the difficulty or characteristics of the datasets. The fluctuations in the lines suggest that the models' performance is not entirely stable and may be affected by the specific examples within each dataset. The "Train" data chart shows the initial learning phase, while the "MATH 500 Test" and "AIME 2025" charts represent the models' generalization ability on unseen data. The higher accuracy on the "MATH 500 Test" suggests that the models are better at generalizing to problems similar to those in the training data. The lower accuracy on the "AIME 2025" data suggests that this dataset presents a greater challenge for the models.