## Histograms: Hidden States Distribution in Neural Network Layers
### Overview
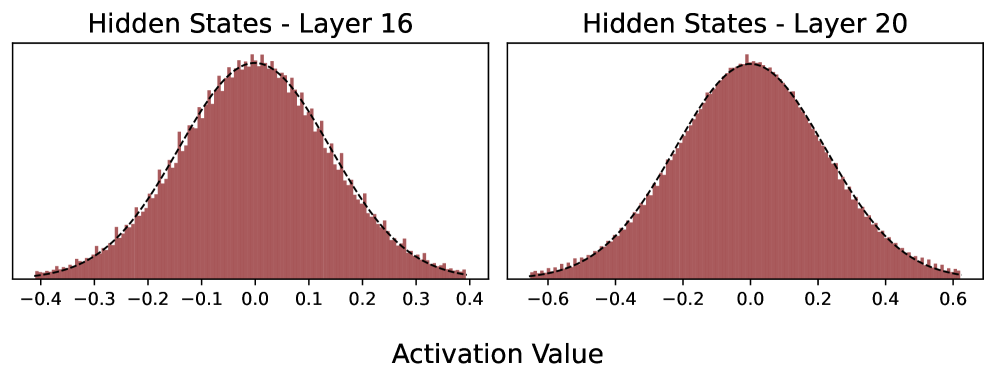
The image contains two side-by-side histograms comparing the distribution of activation values in hidden states of two neural network layers (Layer 16 and Layer 20). Each histogram is overlaid with a dashed line representing a theoretical normal distribution curve.
### Components/Axes
- **X-axis (Horizontal)**: Labeled "Activation Value" with ranges:
- Layer 16: -0.4 to 0.4
- Layer 20: -0.6 to 0.6
- **Y-axis (Vertical)**: Implied frequency/count (no explicit label, but values approximate to 0.05 for Layer 16 and 0.03 for Layer 20).
- **Legends**:
- Top-left: "Hidden States - Layer 16"
- Top-right: "Hidden States - Layer 20"
- **Dashed Lines**: Overlaid on both histograms, representing normal distribution curves matching the data.
### Detailed Analysis
- **Layer 16**:
- Histogram bars are densely packed around the center (0.0 activation value).
- Peak frequency ≈ 0.05 at 0.0 activation value.
- Symmetric distribution with a narrow spread (standard deviation ≈ 0.1).
- Dashed line closely follows the histogram peaks.
- **Layer 20**:
- Histogram bars are more spread out, with a broader distribution.
- Peak frequency ≈ 0.03 at 0.0 activation value.
- Symmetric distribution with a wider spread (standard deviation ≈ 0.2).
- Dashed line aligns with the broader histogram shape.
### Key Observations
1. **Layer 16** exhibits a more concentrated activation distribution, with values tightly clustered near 0.0.
2. **Layer 20** shows a significantly wider spread, indicating greater variability in activation values.
3. Both layers follow a roughly normal distribution, as evidenced by the alignment of the dashed curves with the histograms.
4. The x-axis range for Layer 20 is 50% broader than Layer 16, reflecting its increased variability.
### Interpretation
The data suggests that Layer 16 operates with higher precision, as its activation values are more tightly constrained around the mean. In contrast, Layer 20 demonstrates greater flexibility or generalization, with activation values spreading further from the mean. This could imply that Layer 16 specializes in refining intermediate representations, while Layer 20 handles more diverse or abstract features. The normal distribution patterns indicate stable, Gaussian-like behavior in both layers, typical of well-trained neural networks. The absence of outliers or skewed distributions suggests balanced training across both layers.