\n
## Line Chart: Rouge-L Score vs. Search Depth
### Overview
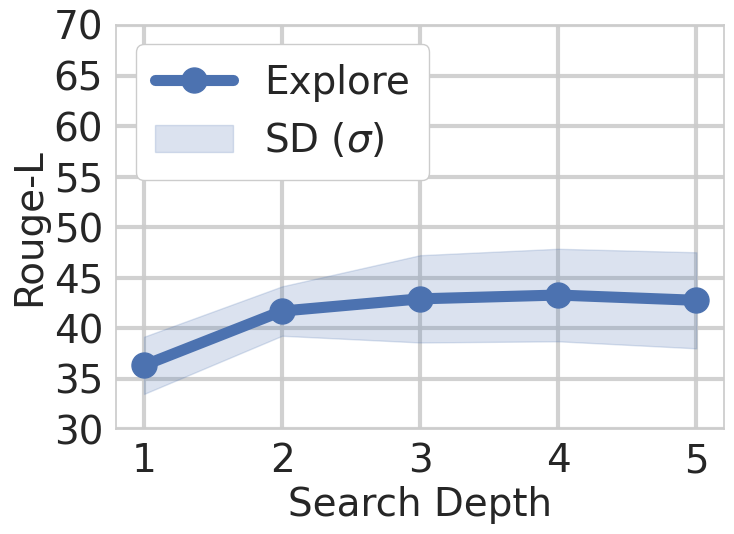
This image presents a line chart illustrating the relationship between Search Depth and Rouge-L score. The chart also displays the standard deviation (SD) around the "Explore" line. The data suggests an initial increase in Rouge-L score with increasing search depth, followed by a plateau and slight decline.
### Components/Axes
* **X-axis:** "Search Depth" ranging from 1 to 5, with tick marks at each integer value.
* **Y-axis:** "Rouge-L" ranging from 30 to 70, with tick marks every 5 units.
* **Data Series 1:** "Explore" - Represented by a solid blue line with circular data points.
* **Data Series 2:** "SD (σ)" - Represented by a light blue shaded area, indicating the standard deviation.
* **Legend:** Located in the top-left corner, labeling the two data series.
### Detailed Analysis
The "Explore" line (blue) shows the following approximate values:
* Search Depth 1: Rouge-L ≈ 36
* Search Depth 2: Rouge-L ≈ 41
* Search Depth 3: Rouge-L ≈ 43
* Search Depth 4: Rouge-L ≈ 43.5
* Search Depth 5: Rouge-L ≈ 42.5
The "SD (σ)" shaded area represents the standard deviation around the "Explore" line. The standard deviation appears to be largest at Search Depth 1, and decreases slightly as Search Depth increases. The approximate range of the standard deviation is:
* Search Depth 1: SD ranges from approximately 32 to 40.
* Search Depth 2: SD ranges from approximately 37 to 45.
* Search Depth 3: SD ranges from approximately 40 to 47.
* Search Depth 4: SD ranges from approximately 41 to 46.
* Search Depth 5: SD ranges from approximately 40 to 45.
The "Explore" line initially slopes upward from Search Depth 1 to Search Depth 3, indicating an increase in Rouge-L score. From Search Depth 3 to Search Depth 5, the line plateaus and then slightly declines, suggesting diminishing returns or potential overfitting with increased search depth.
### Key Observations
* The Rouge-L score increases rapidly between Search Depth 1 and 2.
* The Rouge-L score plateaus between Search Depth 3 and 4.
* The standard deviation is relatively consistent across search depths, with a slight decrease as search depth increases.
* The standard deviation is significant, indicating variability in the Rouge-L score for a given search depth.
### Interpretation
The chart suggests that increasing the search depth initially improves the Rouge-L score, likely by allowing the model to consider more relevant information. However, beyond a certain point (around Search Depth 3), further increasing the search depth does not lead to significant improvements and may even result in a slight decrease in performance. This could be due to the model retrieving less relevant information or encountering noise as the search depth increases. The standard deviation indicates that the performance is not consistent across different runs or datasets, and there is inherent variability in the Rouge-L score for a given search depth. The data suggests an optimal search depth around 3, where the Rouge-L score is maximized while maintaining a reasonable level of stability.