## Line Chart with Error Band: Rouge-L Score vs. Search Depth
### Overview
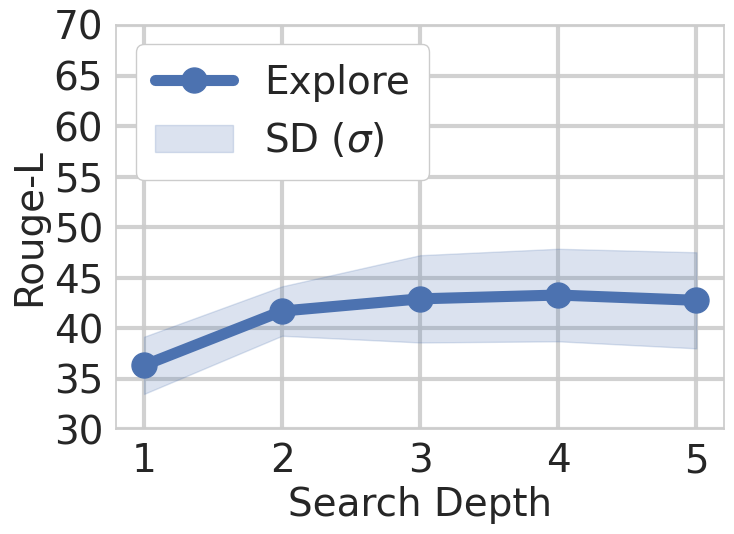
The image is a line chart displaying the relationship between "Search Depth" (x-axis) and a performance metric called "Rouge-L" (y-axis). The chart includes a single data series labeled "Explore" and a shaded region representing the standard deviation (SD, denoted by σ) of the measurements. The overall trend shows an initial rapid improvement in the Rouge-L score that plateaus as search depth increases.
### Components/Axes
* **Chart Type:** Line chart with a shaded error band.
* **X-Axis:**
* **Label:** "Search Depth"
* **Scale:** Linear, with integer markers from 1 to 5.
* **Y-Axis:**
* **Label:** "Rouge-L"
* **Scale:** Linear, ranging from 30 to 70, with major tick marks every 5 units (30, 35, 40, 45, 50, 55, 60, 65, 70).
* **Legend:**
* **Position:** Top-left corner of the plot area.
* **Elements:**
1. **"Explore":** Represented by a solid, dark blue line with circular markers at each data point.
2. **"SD (σ)":** Represented by a light blue, semi-transparent shaded area surrounding the main line.
* **Grid:** A light gray grid is present, with horizontal and vertical lines aligning with the major axis ticks.
### Detailed Analysis
**Data Series: "Explore" (Dark Blue Line with Markers)**
* **Trend Verification:** The line slopes steeply upward from Search Depth 1 to 2, continues to rise more gradually to Depth 4, and then shows a very slight downward slope or plateau at Depth 5.
* **Approximate Data Points:**
* Search Depth 1: Rouge-L ≈ 36
* Search Depth 2: Rouge-L ≈ 42
* Search Depth 3: Rouge-L ≈ 43
* Search Depth 4: Rouge-L ≈ 44
* Search Depth 5: Rouge-L ≈ 43
**Error Band: "SD (σ)" (Light Blue Shaded Area)**
* The shaded region represents the standard deviation around the mean "Explore" line.
* **Width Analysis:** The band is narrowest at Search Depth 1 (spanning approximately 34 to 38). It widens significantly at Depth 2 and remains relatively wide for Depths 3, 4, and 5, indicating greater variability in the Rouge-L scores at higher search depths. The band appears widest around Depths 3 and 4.
### Key Observations
1. **Diminishing Returns:** The most significant gain in Rouge-L score occurs when increasing Search Depth from 1 to 2 (an increase of ~6 points). Subsequent increases in depth yield progressively smaller improvements.
2. **Performance Plateau:** The metric appears to peak at Search Depth 4 (≈44) and shows a slight decrease at Depth 5 (≈43), suggesting a potential performance ceiling or slight degradation with very deep searches.
3. **Increasing Variability:** The standard deviation (shaded area) expands as Search Depth increases. This indicates that while the average performance improves, the consistency or reliability of the results decreases with deeper searches.
4. **Visual Anchors:** The data point at Search Depth 2 (≈42) sits just above the 40 grid line. The point at Depth 4 (≈44) is just below the 45 grid line.
### Interpretation
This chart likely evaluates the performance of an information retrieval, text generation, or similar AI system where "Search Depth" is a controllable parameter. "Rouge-L" is a common metric for evaluating text summarization or translation by measuring longest common subsequence overlap with a reference.
The data suggests a clear trade-off:
* **Efficiency vs. Depth:** A shallow search (Depth 1) is fast but yields lower quality results. Increasing depth to 2 or 3 provides a substantial quality boost.
* **Optimal Range:** The optimal operating point appears to be around Search Depth 3 or 4, where the Rouge-L score is maximized before plateauing.
* **Cost of Depth:** The increasing standard deviation at higher depths implies that while the system *can* achieve high scores, its performance becomes less predictable. This could be due to the system retrieving more diverse or noisy information, leading to greater variance in output quality.
* **Practical Implication:** For deployment, using a Search Depth of 3 might offer the best balance of high average performance, reasonable variability, and lower computational cost compared to Depth 4 or 5. The slight dip at Depth 5 could indicate over-searching, where the system begins to incorporate less relevant information, harming consistency.