## Stacked Bar Chart: Processing Time Allocation Across Task
### Overview
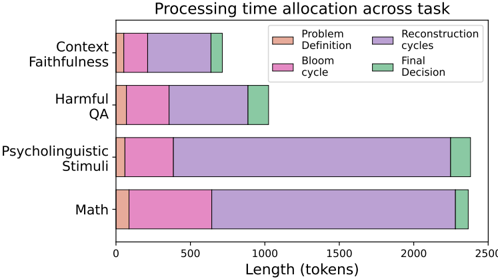
The image is a stacked horizontal bar chart illustrating the processing time allocation across different tasks. The x-axis represents the length in tokens, and the y-axis lists the tasks: Context Faithfulness, Harmful QA, Psycholinguistic Stimuli, and Math. Each bar is segmented into four components, representing different stages of processing: Problem Definition, Bloom cycle, Reconstruction cycles, and Final Decision.
### Components/Axes
* **Title:** Processing time allocation across task
* **X-axis:** Length (tokens), with scale markers at 0, 500, 1000, 1500, 2000, and 2500.
* **Y-axis:** Task categories: Context Faithfulness, Harmful QA, Psycholinguistic Stimuli, and Math.
* **Legend:** Located at the top-right of the chart.
* Problem Definition (light orange)
* Bloom cycle (light pink)
* Reconstruction cycles (light purple)
* Final Decision (light green)
### Detailed Analysis
Here's a breakdown of the length (in tokens) for each task and processing stage:
* **Context Faithfulness:**
* Problem Definition: ~50 tokens
* Bloom cycle: ~150 tokens
* Reconstruction cycles: ~650 tokens
* Final Decision: ~150 tokens
* Total Length: ~1000 tokens
* **Harmful QA:**
* Problem Definition: ~50 tokens
* Bloom cycle: ~250 tokens
* Reconstruction cycles: ~700 tokens
* Final Decision: ~200 tokens
* Total Length: ~1200 tokens
* **Psycholinguistic Stimuli:**
* Problem Definition: ~50 tokens
* Bloom cycle: ~400 tokens
* Reconstruction cycles: ~1900 tokens
* Final Decision: ~200 tokens
* Total Length: ~2550 tokens
* **Math:**
* Problem Definition: ~100 tokens
* Bloom cycle: ~500 tokens
* Reconstruction cycles: ~1700 tokens
* Final Decision: ~200 tokens
* Total Length: ~2500 tokens
### Key Observations
* The "Reconstruction cycles" stage dominates the processing time for all tasks, especially for "Psycholinguistic Stimuli" and "Math".
* "Context Faithfulness" requires the least processing time overall.
* "Problem Definition" consistently takes the least amount of time across all tasks.
* "Final Decision" takes a similar amount of time for all tasks, around 150-200 tokens.
### Interpretation
The chart provides insights into the computational demands of different tasks. The dominance of "Reconstruction cycles" suggests that this stage is the most complex and time-consuming part of the process. The relatively short "Problem Definition" stage indicates that the initial setup is less demanding than the subsequent processing. The similarity in "Final Decision" time across tasks might indicate a standardized procedure for concluding each task. The "Psycholinguistic Stimuli" and "Math" tasks require significantly more processing power than "Context Faithfulness" and "Harmful QA", likely due to the nature of the computations involved.