\n
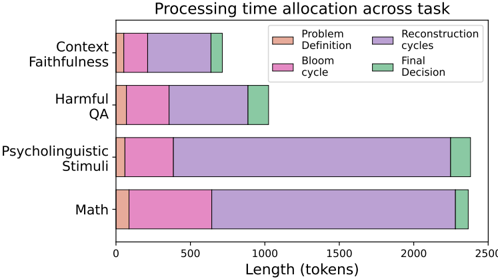
## Stacked Bar Chart: Processing Time Allocation Across Task
### Overview
This is a stacked horizontal bar chart illustrating the processing time allocation for four different tasks: Context Faithfulness, Harmful QA, Psycholinguistic Stimuli, and Math. The x-axis represents length in tokens, ranging from 0 to 2500. The chart uses stacked segments to show the proportion of time spent on different phases of processing: Problem Definition, Bloom cycle, Reconstruction cycles, and Final Decision.
### Components/Axes
* **Title:** "Processing time allocation across task" (centered at the top)
* **Y-axis:** Task names (Context Faithfulness, Harmful QA, Psycholinguistic Stimuli, Math) - listed vertically from top to bottom.
* **X-axis:** Length (tokens) - ranging from 0 to 2500.
* **Legend:** Located in the top-right corner, defining the color-coding for each processing phase:
* Problem Definition (Orange)
* Bloom cycle (Pink)
* Reconstruction cycles (Purple)
* Final Decision (Green)
### Detailed Analysis
Let's analyze each task individually, estimating values based on visual inspection.
**1. Context Faithfulness:**
* Problem Definition: Approximately 100 tokens.
* Bloom cycle: Approximately 200 tokens.
* Reconstruction cycles: Approximately 100 tokens.
* Final Decision: Approximately 100 tokens.
* Total Length: ~500 tokens
**2. Harmful QA:**
* Problem Definition: Approximately 150 tokens.
* Bloom cycle: Approximately 300 tokens.
* Reconstruction cycles: Approximately 1000 tokens.
* Final Decision: Approximately 300 tokens.
* Total Length: ~1750 tokens
**3. Psycholinguistic Stimuli:**
* Problem Definition: Approximately 200 tokens.
* Bloom cycle: Approximately 700 tokens.
* Reconstruction cycles: Approximately 1200 tokens.
* Final Decision: Approximately 200 tokens.
* Total Length: ~2300 tokens
**4. Math:**
* Problem Definition: Approximately 200 tokens.
* Bloom cycle: Approximately 600 tokens.
* Reconstruction cycles: Approximately 1300 tokens.
* Final Decision: Approximately 300 tokens.
* Total Length: ~2400 tokens
**Trends:**
* The "Reconstruction cycles" phase consistently occupies the largest portion of the processing time for all tasks.
* "Problem Definition" consistently occupies the smallest portion of the processing time.
* The total processing time (length in tokens) varies significantly across tasks, with Math and Psycholinguistic Stimuli requiring the most processing time.
### Key Observations
* The "Reconstruction cycles" phase dominates processing time, suggesting that this is the most computationally intensive or time-consuming part of the process.
* The tasks "Psycholinguistic Stimuli" and "Math" have similar processing time profiles, with a large proportion dedicated to "Reconstruction cycles".
* "Context Faithfulness" has the shortest overall processing time.
* "Harmful QA" has a relatively large "Bloom cycle" component compared to other tasks.
### Interpretation
The chart demonstrates how processing time is allocated across different phases for various tasks. The dominance of "Reconstruction cycles" suggests that the core processing logic or iterative refinement steps are the primary drivers of computational cost. The variation in total processing time across tasks indicates that the complexity or inherent difficulty of each task influences the overall processing effort. The relatively short processing time for "Context Faithfulness" might suggest that this task is simpler or more streamlined than the others. The larger "Bloom cycle" for "Harmful QA" could indicate that this task requires more initial exploration or generation of potential responses.
The chart provides valuable insights into the computational demands of different tasks, which can be used to optimize processing pipelines, allocate resources effectively, and identify areas for improvement. For example, if the goal is to reduce processing time, focusing on optimizing the "Reconstruction cycles" phase would likely yield the greatest benefits.