## Horizontal Stacked Bar Chart: Processing Time Allocation Across Tasks
### Overview
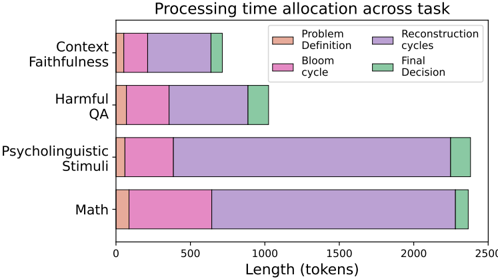
This is a horizontal stacked bar chart titled "Processing time allocation across tasks." It visualizes the distribution of processing time, measured in tokens, across four distinct tasks. Each task's total processing time is broken down into four sequential phases, represented by colored segments within each bar.
### Components/Axes
* **Chart Title:** "Processing time allocation across tasks" (Top center)
* **Y-Axis (Vertical):** Lists four task categories. From top to bottom:
1. Context Faithfulness
2. Harmful QA
3. Psycholinguistic Stimuli
4. Math
* **X-Axis (Horizontal):** Labeled "Length (tokens)". It has numerical markers at 0, 500, 1000, 1500, 2000, and 2500.
* **Legend:** Located in the top-right corner of the chart area. It defines the four color-coded phases:
* **Problem Definition** (Light peach/tan color)
* **Bloom cycle** (Pink/magenta color)
* **Reconstruction cycles** (Light purple/lavender color)
* **Final Decision** (Light green/mint color)
### Detailed Analysis
The chart displays the approximate token length for each phase within each task. Values are estimated based on the x-axis scale.
**1. Context Faithfulness (Top Bar)**
* **Total Length:** ~700 tokens
* **Phase Breakdown (approximate):**
* Problem Definition: ~100 tokens
* Bloom cycle: ~200 tokens
* Reconstruction cycles: ~400 tokens
* Final Decision: ~50 tokens
* **Trend:** The "Reconstruction cycles" phase is the largest component, followed by "Bloom cycle."
**2. Harmful QA (Second Bar)**
* **Total Length:** ~1050 tokens
* **Phase Breakdown (approximate):**
* Problem Definition: ~50 tokens
* Bloom cycle: ~350 tokens
* Reconstruction cycles: ~550 tokens
* Final Decision: ~100 tokens
* **Trend:** "Reconstruction cycles" is the dominant phase, with "Bloom cycle" also being substantial.
**3. Psycholinguistic Stimuli (Third Bar)**
* **Total Length:** ~2400 tokens
* **Phase Breakdown (approximate):**
* Problem Definition: ~50 tokens
* Bloom cycle: ~350 tokens
* Reconstruction cycles: ~1900 tokens
* Final Decision: ~100 tokens
* **Trend:** This task has the longest total processing time. The "Reconstruction cycles" phase is overwhelmingly dominant, accounting for the vast majority of the tokens.
**4. Math (Bottom Bar)**
* **Total Length:** ~2350 tokens
* **Phase Breakdown (approximate):**
* Problem Definition: ~100 tokens
* Bloom cycle: ~550 tokens
* Reconstruction cycles: ~1650 tokens
* Final Decision: ~50 tokens
* **Trend:** Similar to Psycholinguistic Stimuli, "Reconstruction cycles" is the largest phase. The "Bloom cycle" is also notably longer here than in the first two tasks.
### Key Observations
1. **Dominant Phase:** The "Reconstruction cycles" (light purple) phase is consistently the largest or second-largest component across all four tasks, indicating it is the most time-consuming part of the process.
2. **Task Complexity:** "Psycholinguistic Stimuli" and "Math" require significantly more total processing tokens (~2400) than "Context Faithfulness" (~700) and "Harmful QA" (~1050).
3. **Phase Proportions:** The "Problem Definition" and "Final Decision" phases are relatively small and consistent in size across all tasks, suggesting these are quick, fixed-overhead steps.
4. **Bloom Cycle Variance:** The "Bloom cycle" phase shows the most variation in length between tasks, being particularly long for "Math" and "Harmful QA."
### Interpretation
This chart provides insight into the computational "effort" required for different types of tasks, broken down by processing stage. The data suggests that the core iterative processing ("Reconstruction cycles") is the primary driver of cost, especially for complex tasks involving language understanding (Psycholinguistic Stimuli) and formal reasoning (Math). The "Bloom cycle," which may involve generating or evaluating multiple possibilities, is also a major factor for tasks that likely require exploring different answers or interpretations (Harmful QA, Math). The consistent, small size of the initial ("Problem Definition") and final ("Final Decision") phases implies that the system's overhead for setting up and concluding a task is minimal compared to the core processing work. The significant difference in total length between task groups highlights that not all queries are equal in resource demand; tasks requiring deep analysis or generation are substantially more expensive.