## Bar Chart: Processing time allocation across task
### Overview
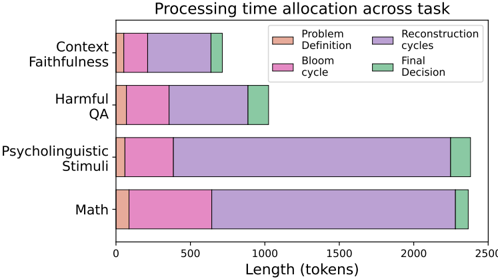
The chart visualizes the distribution of processing time (measured in tokens) across four task categories: Context, Faithfulness, Harmful QA, Psycholinguistic Stimuli, and Math. Each task's total processing time is divided into four components: Problem Definition (orange), Bloom cycle (pink), Reconstruction cycles (purple), and Final Decision (green). The x-axis ranges from 0 to 2500 tokens, while the y-axis lists task categories.
### Components/Axes
- **Y-axis (Categories)**:
- Context
- Faithfulness
- Harmful QA
- Psycholinguistic Stimuli
- Math
- **X-axis (Length)**:
- Scale: 0 to 2500 tokens (approximate)
- Labels: Numerical increments (0, 500, 1000, 1500, 2000, 2500)
- **Legend**:
- Position: Top-right corner
- Colors:
- Orange: Problem Definition
- Pink: Bloom cycle
- Purple: Reconstruction cycles
- Green: Final Decision
### Detailed Analysis
1. **Context** (Total ~700 tokens):
- Problem Definition: ~100 tokens (orange)
- Bloom cycle: ~200 tokens (pink)
- Reconstruction cycles: ~300 tokens (purple)
- Final Decision: ~100 tokens (green)
2. **Faithfulness** (Total ~900 tokens):
- Problem Definition: ~100 tokens (orange)
- Bloom cycle: ~200 tokens (pink)
- Reconstruction cycles: ~400 tokens (purple)
- Final Decision: ~200 tokens (green)
3. **Harmful QA** (Total ~1000 tokens):
- Problem Definition: ~100 tokens (orange)
- Bloom cycle: ~200 tokens (pink)
- Reconstruction cycles: ~400 tokens (purple)
- Final Decision: ~300 tokens (green)
4. **Psycholinguistic Stimuli** (Total ~2300 tokens):
- Problem Definition: ~100 tokens (orange)
- Bloom cycle: ~300 tokens (pink)
- Reconstruction cycles: ~1800 tokens (purple)
- Final Decision: ~100 tokens (green)
5. **Math** (Total ~2300 tokens):
- Problem Definition: ~100 tokens (orange)
- Bloom cycle: ~500 tokens (pink)
- Reconstruction cycles: ~1700 tokens (purple)
- Final Decision: ~100 tokens (green)
### Key Observations
- **Reconstruction cycles dominate** in all tasks, accounting for 50-80% of total processing time.
- **Bloom cycle** is most prominent in the **Math** task (~22% of total time).
- **Final Decision** is consistently the smallest segment (~4-5% of total time) across all tasks.
- **Problem Definition** is the smallest segment in all tasks (~14-16% of total time).
### Interpretation
The data suggests that **Reconstruction cycles** are the most resource-intensive phase across all tasks, likely reflecting complex cognitive processing requirements. The **Math** task uniquely allocates significant time to the **Bloom cycle**, possibly indicating iterative problem-solving steps. The **Psycholinguistic Stimuli** task shows the highest absolute processing time, with Reconstruction cycles consuming nearly 80% of its total time. The **Final Decision** phase appears optimized across all tasks, suggesting efficient conclusion-drawing mechanisms. The consistent small allocation to **Problem Definition** may indicate standardized initial processing requirements. These patterns could reflect task complexity hierarchies or cognitive load distributions in the modeled system.