## Chart/Diagram Type: SHAP Value Analysis with/without Prior Knowledge
### Overview
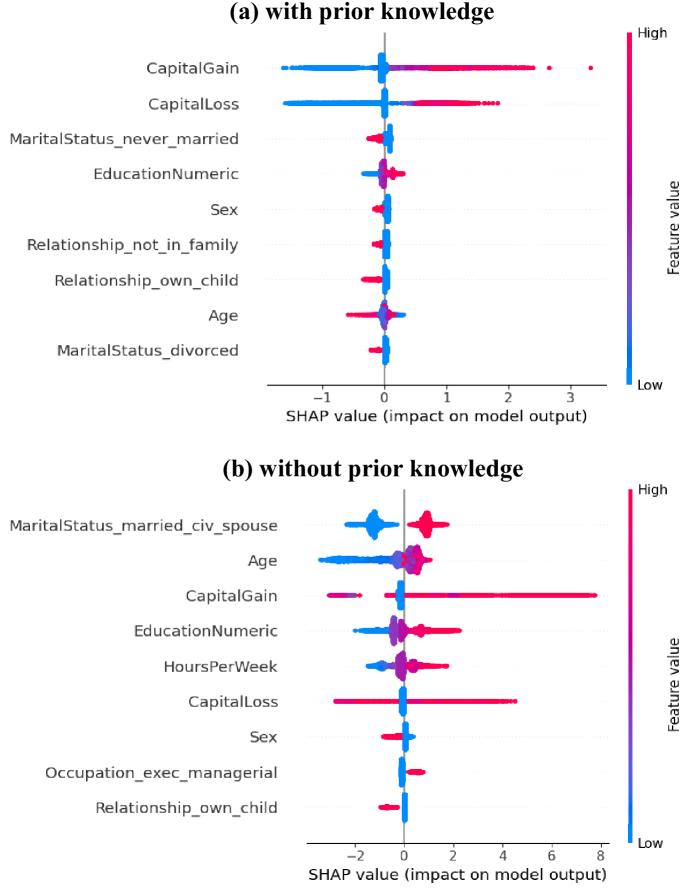
The image contains two side-by-side SHAP value plots comparing feature impacts on a model's output. Chart (a) represents analysis "with prior knowledge," while chart (b) represents analysis "without prior knowledge." Both charts use a color gradient (blue to red) to indicate feature values, with SHAP values on the x-axis and categorical features on the y-axis.
### Components/Axes
- **Y-Axis (Features)**:
- Chart (a):
`CapitalGain`, `CapitalLoss`, `MaritalStatus_never_married`, `EducationNumeric`, `Sex`, `Relationship_not_in_family`, `Relationship_own_child`, `Age`, `MaritalStatus_divorced`
- Chart (b):
`MaritalStatus_married_civ_spouse`, `Age`, `CapitalGain`, `EducationNumeric`, `HoursPerWeek`, `CapitalLoss`, `Sex`, `Occupation_exec_managerial`, `Relationship_own_child`
- **X-Axis**: SHAP value (impact on model output), ranging from -3 to +3 in chart (a) and -2 to +8 in chart (b).
- **Legend**: Color gradient from blue (low feature value) to red (high feature value), positioned on the right side of each chart.
### Detailed Analysis
#### Chart (a): With Prior Knowledge
- **Key Features**:
- `CapitalGain`: Dominates with SHAP values clustered near +2 to +3 (red), indicating strong positive impact.
- `CapitalLoss`: Negative SHAP values (-1 to 0), suggesting negative impact.
- `Age`: Balanced distribution around 0, with slight positive skew.
- `EducationNumeric`: Moderate positive impact (0.5–1.5).
- `MaritalStatus_never_married` and `MaritalStatus_divorced`: Minimal impact (near 0).
- **Color Distribution**:
- Red dominates for `CapitalGain` and `EducationNumeric`.
- Blue dominates for `CapitalLoss` and marital status categories.
#### Chart (b): Without Prior Knowledge
- **Key Features**:
- `CapitalLoss`: Extreme positive SHAP values (+4 to +5), far exceeding chart (a).
- `CapitalGain`: Reduced impact (0.5–1.5), less dominant than in chart (a).
- `Age`: Broader distribution (-1 to +1), with higher variability.
- `Occupation_exec_managerial`: Moderate positive impact (1–2).
- `Relationship_own_child`: Minimal impact (near 0).
- **Color Distribution**:
- Red dominates for `CapitalLoss` and `Occupation_exec_managerial`.
- Blue dominates for `Age` and `Relationship_own_child`.
### Key Observations
1. **Prior Knowledge Stabilizes Feature Impact**:
- In chart (a), `CapitalGain` and `EducationNumeric` show consistent, moderate impacts.
- In chart (b), `CapitalLoss` becomes an outlier with extreme SHAP values, suggesting overfitting without prior knowledge.
2. **Feature Sensitivity**:
- `CapitalLoss` shifts from negative (chart a) to highly positive (chart b), indicating model instability.
- `Age` and `MaritalStatus` categories show reduced significance in chart (b).
3. **SHAP Value Spread**:
- Chart (b) has a wider SHAP value range (+8 vs. +3), implying greater model unpredictability.
### Interpretation
The data demonstrates that prior knowledge acts as a regularizer, stabilizing feature importance and preventing overreliance on specific variables like `CapitalLoss`. Without prior knowledge, the model amplifies the impact of `CapitalLoss`, potentially leading to biased or unreliable predictions. The reduced influence of demographic features (e.g., `Age`, `MaritalStatus`) in chart (b) suggests the model may focus excessively on financial metrics, raising ethical concerns about fairness. This highlights the importance of incorporating domain knowledge to ensure model robustness and interpretability.