## Chart: Successful Runs for Reliable Agents
### Overview
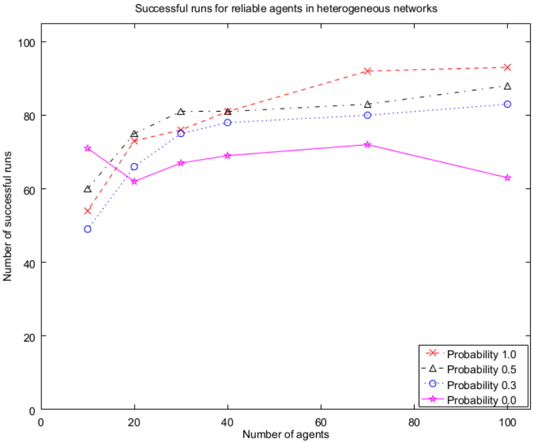
The image is a line chart comparing the number of successful runs for reliable agents in heterogeneous networks, across varying numbers of agents and probabilities. The x-axis represents the number of agents, and the y-axis represents the number of successful runs. Four different probabilities (1.0, 0.5, 0.3, and 0.0) are plotted as separate lines.
### Components/Axes
* **Title:** Successful runs for reliable agents in heterogeneous networks
* **X-axis:** Number of agents, with markers at 0, 20, 40, 60, 80, and 100.
* **Y-axis:** Number of successful runs, with markers at 0, 20, 40, 60, 80, and 100.
* **Legend:** Located in the bottom-right corner.
* Red dashed line with 'x' markers: Probability 1.0
* Black dashed-dotted line with triangle markers: Probability 0.5
* Blue dotted line with circle markers: Probability 0.3
* Magenta solid line with star markers: Probability 0.0
### Detailed Analysis
* **Probability 1.0 (Red dashed line with 'x' markers):**
* Trend: Generally increasing.
* Data Points: Approximately (10, 55), (20, 75), (40, 80), (80, 92), (100, 92).
* **Probability 0.5 (Black dashed-dotted line with triangle markers):**
* Trend: Generally increasing.
* Data Points: Approximately (10, 60), (20, 78), (40, 82), (80, 85), (100, 88).
* **Probability 0.3 (Blue dotted line with circle markers):**
* Trend: Generally increasing.
* Data Points: Approximately (10, 50), (20, 73), (40, 81), (80, 82), (100, 85).
* **Probability 0.0 (Magenta solid line with star markers):**
* Trend: Increasing initially, then plateaus and slightly decreases.
* Data Points: Approximately (10, 72), (20, 63), (40, 68), (80, 72), (100, 63).
### Key Observations
* The number of successful runs generally increases with the number of agents for probabilities 1.0, 0.5, and 0.3.
* Probability 1.0 consistently yields the highest number of successful runs across all agent counts.
* Probability 0.0 shows a different trend, initially increasing but then plateauing and decreasing slightly at higher agent counts.
* The most significant increase in successful runs occurs between 10 and 20 agents for probabilities 1.0, 0.5, and 0.3.
### Interpretation
The chart suggests that higher probabilities for reliable agents in heterogeneous networks lead to a greater number of successful runs. The performance of probabilities 1.0, 0.5, and 0.3 improves as the number of agents increases, indicating that more agents can leverage the reliability to achieve success. The behavior of probability 0.0 is an anomaly, suggesting that without any reliability, increasing the number of agents does not necessarily lead to better performance, and may even slightly decrease it beyond a certain point. This could be due to increased interference or complexity in the network when no agents are reliable.