## Line Chart: Successful Runs for Reliable Agents in Heterogeneous Networks
### Overview
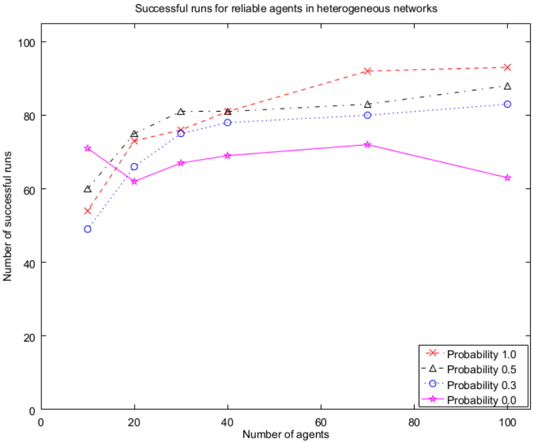
The image presents a line chart illustrating the relationship between the number of agents and the number of successful runs for reliable agents in heterogeneous networks, across different probability values. The chart displays four lines, each representing a different probability level (1.0, 0.5, 0.3, and 0.0).
### Components/Axes
* **Title:** "Successful runs for reliable agents in heterogeneous networks" (centered at the top)
* **X-axis:** "Number of agents" (ranging from 0 to 80, with tick marks at 0, 20, 40, 60, and 80)
* **Y-axis:** "Number of successful runs" (ranging from 20 to 100, with tick marks at 20, 40, 60, 80, and 100)
* **Legend:** Located in the bottom-right corner, listing the probability values and corresponding line styles/colors:
* Probability 1.0 (Red, 'x' marker, dashed line)
* Probability 0.5 (Black, triangle marker, dashed line)
* Probability 0.3 (Blue, circle marker, dashed line)
* Probability 0.0 (Magenta, square marker, solid line)
### Detailed Analysis
Here's a breakdown of each line's trend and approximate data points, verified against the legend:
* **Probability 1.0 (Red, 'x' marker, dashed line):** This line shows a generally upward trend.
* At 0 agents: ~55 successful runs
* At 20 agents: ~75 successful runs
* At 40 agents: ~82 successful runs
* At 60 agents: ~88 successful runs
* At 80 agents: ~95 successful runs
* **Probability 0.5 (Black, triangle marker, dashed line):** This line also shows an upward trend, but less pronounced than the 1.0 probability line.
* At 0 agents: ~60 successful runs
* At 20 agents: ~78 successful runs
* At 40 agents: ~82 successful runs
* At 60 agents: ~84 successful runs
* At 80 agents: ~87 successful runs
* **Probability 0.3 (Blue, circle marker, dashed line):** This line initially increases, then plateaus.
* At 0 agents: ~50 successful runs
* At 20 agents: ~78 successful runs
* At 40 agents: ~80 successful runs
* At 60 agents: ~80 successful runs
* At 80 agents: ~78 successful runs
* **Probability 0.0 (Magenta, square marker, solid line):** This line shows a slight initial increase, followed by a decrease.
* At 0 agents: ~70 successful runs
* At 20 agents: ~72 successful runs
* At 40 agents: ~75 successful runs
* At 60 agents: ~74 successful runs
* At 80 agents: ~65 successful runs
### Key Observations
* Higher probability values (1.0 and 0.5) generally correlate with a higher number of successful runs, and the number of successful runs increases with the number of agents.
* The probability of 0.3 shows a plateau effect, where increasing the number of agents beyond 40 does not significantly increase the number of successful runs.
* The probability of 0.0 shows a decrease in successful runs as the number of agents increases beyond 40.
* The lines are all dashed except for the probability 0.0 line, which is solid.
### Interpretation
The chart suggests that the probability of an agent being reliable has a significant impact on the number of successful runs in heterogeneous networks. As the probability increases, the number of successful runs tends to increase as well. However, there appears to be a diminishing return with increasing numbers of agents for certain probability levels (0.3), and even a negative correlation for others (0.0).
This could indicate that beyond a certain point, adding more agents with lower reliability (probability 0.0) actually *decreases* the overall success rate, potentially due to increased interference or conflicting actions. The plateau observed at probability 0.3 suggests that the benefits of adding more agents are limited when their reliability is moderate. The data implies that a balance between the number of agents and their individual reliability is crucial for maximizing the number of successful runs in these networks. The dashed lines for probabilities 1.0, 0.5, and 0.3 may indicate that these are modeled or estimated values, while the solid line for 0.0 could represent actual observed data.