\n
## Line Chart: Successful runs for reliable agents in heterogeneous networks
### Overview
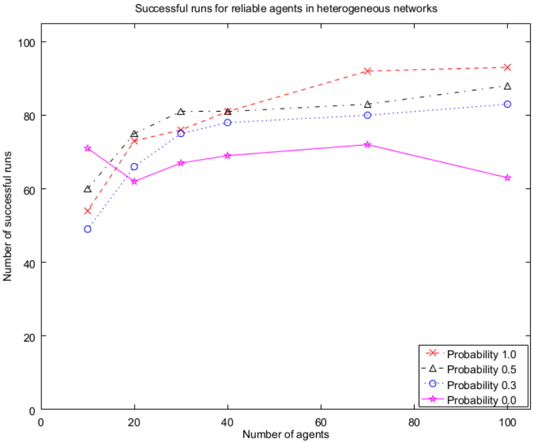
The image is a line chart displaying the relationship between the number of agents in a network and the number of successful runs achieved by "reliable agents" under four different probability conditions. The chart suggests an experiment or simulation measuring how agent count and a probability parameter (likely related to reliability or success chance) affect overall task success in a heterogeneous network environment.
### Components/Axes
* **Chart Title:** "Successful runs for reliable agents in heterogeneous networks" (centered at the top).
* **X-Axis:** Labeled "Number of agents". Scale ranges from 0 to 100 with major tick marks at 0, 20, 40, 60, 80, 100.
* **Y-Axis:** Labeled "Number of successful runs". Scale ranges from 0 to 100 with major tick marks at 0, 20, 40, 60, 80, 100.
* **Legend:** Located in the bottom-right corner of the plot area. It defines four data series:
* `--x--` Red dashed line with 'x' markers: **Probability 1.0**
* `--^--` Black dash-dot line with upward-pointing triangle markers: **Probability 0.5**
* `--o--` Blue dotted line with circle markers: **Probability 0.3**
* `--*--` Magenta solid line with star/asterisk markers: **Probability 0.0**
### Detailed Analysis
Data points are plotted at x-values (Number of agents) of approximately 10, 20, 30, 40, 70, and 100. The following are approximate y-values (Number of successful runs) extracted by visual inspection, with inherent uncertainty.
**1. Probability 1.0 (Red 'x' line):**
* **Trend:** Shows a strong, consistent upward trend that begins to plateau after 70 agents.
* **Data Points:**
* At 10 agents: ~54 successful runs
* At 20 agents: ~73
* At 30 agents: ~81
* At 40 agents: ~81
* At 70 agents: ~92
* At 100 agents: ~93
**2. Probability 0.5 (Black triangle line):**
* **Trend:** Shows a steady upward trend, increasing at a slightly slower rate than the 1.0 probability line.
* **Data Points:**
* At 10 agents: ~60
* At 20 agents: ~75
* At 30 agents: ~81
* At 40 agents: ~82
* At 70 agents: ~83
* At 100 agents: ~88
**3. Probability 0.3 (Blue circle line):**
* **Trend:** Shows a moderate upward trend, consistently below the 0.5 and 1.0 probability lines.
* **Data Points:**
* At 10 agents: ~49
* At 20 agents: ~66
* At 30 agents: ~75
* At 40 agents: ~78
* At 70 agents: ~80
* At 100 agents: ~83
**4. Probability 0.0 (Magenta star line):**
* **Trend:** Shows a non-monotonic, fluctuating trend. It starts relatively high, dips, recovers slightly, and then declines at the highest agent count.
* **Data Points:**
* At 10 agents: ~71
* At 20 agents: ~62
* At 30 agents: ~67
* At 40 agents: ~69
* At 70 agents: ~72
* At 100 agents: ~63
### Key Observations
1. **Inverse Initial Relationship:** At the lowest agent count (10), the series with the *lowest* probability (0.0) has the *highest* number of successful runs (~71), while the series with the *highest* probability (1.0) has one of the *lowest* (~54). This relationship inverts as the number of agents increases.
2. **Convergence and Plateau:** All three non-zero probability lines (1.0, 0.5, 0.3) show a trend of increasing successful runs with more agents, and their growth rates slow, suggesting a plateau effect as the network scales. The 1.0 probability line achieves the highest overall success.
3. **Anomaly of Probability 0.0:** The "Probability 0.0" series behaves distinctly. It does not follow the general upward trend. Its performance is erratic and ultimately declines when moving from 70 to 100 agents, suggesting a different underlying dynamic or a potential system limit when the probability parameter is zero.
4. **Crossover Points:** The lines for Probability 1.0 and 0.5 cross between 20 and 30 agents. The line for Probability 0.0 crosses below all other lines after approximately 20 agents.
### Interpretation
This chart likely visualizes results from a multi-agent system simulation. The "Probability" parameter in the legend is central to interpretation. It could represent:
* The inherent reliability or success probability of individual agents.
* The probability of successful communication or task execution between agents.
* A parameter controlling network heterogeneity or fault tolerance.
**What the data suggests:**
* **Scalability Benefit:** For non-zero probabilities, increasing the number of agents generally improves the total number of successful runs, indicating that redundancy or collaboration in a larger network compensates for individual failures. The benefit diminishes at high agent counts (plateau).
* **Critical Role of the Probability Parameter:** Higher probability values lead to significantly better performance at scale. The system with Probability 1.0 is the most robust and scalable.
* **Pathological Case at Zero:** The "Probability 0.0" case is anomalous. If this represents a baseline of zero agent reliability or zero communication success, the initial high success rate is puzzling. It might indicate a different algorithm or fallback mechanism activates at this extreme, which performs poorly and unstably as the network grows. This line is a critical outlier that warrants investigation into the simulation's rules for this condition.
* **Network Heterogeneity:** The title specifies "heterogeneous networks." The varying performance across probabilities may reflect how different agent capabilities or network conditions (modeled by the probability parameter) impact overall system resilience. The chart demonstrates that heterogeneity, when paired with sufficient agent count and non-zero reliability, can lead to high system-level success.