## Line Graph: Successful runs for reliable agents in heterogeneous networks
### Overview
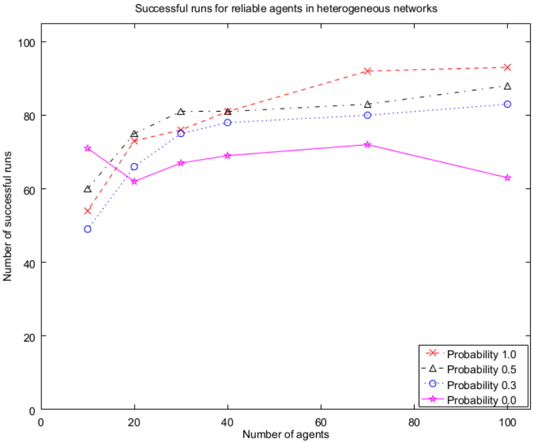
The chart illustrates the relationship between the number of agents in a network and the number of successful runs achieved by agents under different probability settings. Four distinct probability scenarios (1.0, 0.5, 0.3, 0.0) are represented by unique line styles and markers. The y-axis measures successful runs (0–100), while the x-axis tracks the number of agents (0–100).
### Components/Axes
- **X-axis**: "Number of agents" (0–100, linear scale)
- **Y-axis**: "Number of successful runs" (0–100, linear scale)
- **Legend**: Located in the bottom-right corner, with four entries:
- Red "X" marker: Probability 1.0
- Black triangle: Probability 0.5
- Blue circle: Probability 0.3
- Magenta star: Probability 0.0
### Detailed Analysis
1. **Probability 1.0 (Red X)**:
- Starts at ~55 successful runs at 0 agents.
- Increases steadily to ~90 runs at 100 agents.
- Slope: Consistent upward trend.
2. **Probability 0.5 (Black Triangle)**:
- Begins at ~60 runs at 0 agents.
- Peaks at ~80 runs near 40 agents.
- Slight decline to ~85 runs at 100 agents.
- Slope: Initial rise, then plateau with minor dip.
3. **Probability 0.3 (Blue Circle)**:
- Starts at ~50 runs at 0 agents.
- Rises to ~80 runs at 100 agents.
- Slope: Gradual upward trend with minor fluctuations.
4. **Probability 0.0 (Magenta Star)**:
- Begins at ~70 runs at 0 agents.
- Drops to ~60 runs at 20 agents.
- Recovers to ~60 runs at 100 agents.
- Slope: Initial decline, then stabilization.
### Key Observations
- **Probability Correlation**: Higher probabilities (1.0 > 0.5 > 0.3) generally correlate with higher successful runs.
- **Anomaly**: The magenta star (Probability 0.0) exhibits an initial drop followed by recovery, unlike other lines.
- **Convergence**: At 100 agents, all lines except Probability 0.0 converge between ~80–90 runs.
### Interpretation
The data suggests that agent reliability in heterogeneous networks improves with higher probability settings. Probability 1.0 achieves the most consistent success, while Probability 0.0 shows unexpected volatility—potentially indicating a threshold effect where low-probability agents initially fail but stabilize as network complexity increases. The magenta line’s dip at 20 agents may reflect a critical failure point in sparse networks, though recovery at scale implies adaptive mechanisms. This could inform network design strategies prioritizing higher-probability agents for critical tasks.