## Line Graph: Model Accuracy Across Baselines
### Overview
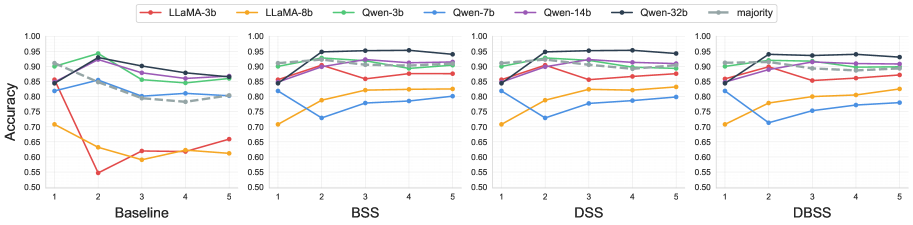
The image displays four line graphs comparing the accuracy of various language models (LLaMA-3b, LLaMA-8b, Qwen-3b, Qwen-7b, Qwen-14b, Qwen-32b, and "majority") across four baseline categories: Baseline, BSS, DSS, and DBSs. The y-axis represents accuracy (0.5 to 1.0), while the x-axis categorizes the baselines. Each line corresponds to a model, with colors matching the legend at the top.
### Components/Axes
- **X-axis (Baselines)**: Labeled "Baseline," "BSS," "DSS," "DBSs" (categorical).
- **Y-axis (Accuracy)**: Labeled "Accuracy" with a scale from 0.5 to 1.0.
- **Legend**: Positioned at the top, mapping colors to models:
- Red: LLaMA-3b
- Orange: LLaMA-8b
- Green: Qwen-3b
- Blue: Qwen-7b
- Purple: Qwen-14b
- Black: Qwen-32b
- Gray (dashed): Majority (baseline reference).
### Detailed Analysis
#### Baseline
- **LLaMA-3b (Red)**: Starts at ~0.85, drops sharply to ~0.55 at BSS, then fluctuates between ~0.6 and ~0.7.
- **LLaMA-8b (Orange)**: Begins at ~0.7, drops to ~0.6 at BSS, then stabilizes around ~0.65.
- **Qwen-3b (Green)**: Starts at ~0.85, dips to ~0.8 at BSS, then rises to ~0.85.
- **Qwen-7b (Blue)**: Begins at ~0.8, drops to ~0.75 at BSS, then stabilizes at ~0.8.
- **Qwen-14b (Purple)**: Starts at ~0.85, dips to ~0.8 at BSS, then rises to ~0.85.
- **Qwen-32b (Black)**: Starts at ~0.85, dips to ~0.8 at BSS, then stabilizes at ~0.85.
- **Majority (Gray)**: Starts at ~0.8, drops to ~0.75 at BSS, then stabilizes at ~0.8.
#### BSS
- **LLaMA-3b**: Recovers to ~0.65, then fluctuates between ~0.6 and ~0.7.
- **LLaMA-8b**: Rises to ~0.7, then stabilizes at ~0.75.
- **Qwen-3b**: Rises to ~0.85, then dips to ~0.8.
- **Qwen-7b**: Rises to ~0.8, then stabilizes at ~0.85.
- **Qwen-14b**: Rises to ~0.9, then dips to ~0.85.
- **Qwen-32b**: Rises to ~0.9, then stabilizes at ~0.9.
- **Majority**: Rises to ~0.85, then stabilizes at ~0.85.
#### DSS
- **LLaMA-3b**: Stabilizes at ~0.7, then rises to ~0.75.
- **LLaMA-8b**: Rises to ~0.75, then stabilizes at ~0.8.
- **Qwen-3b**: Rises to ~0.85, then stabilizes at ~0.85.
- **Qwen-7b**: Rises to ~0.85, then stabilizes at ~0.85.
- **Qwen-14b**: Rises to ~0.9, then stabilizes at ~0.9.
- **Qwen-32b**: Rises to ~0.9, then stabilizes at ~0.9.
- **Majority**: Rises to ~0.85, then stabilizes at ~0.85.
#### DBSs
- **LLaMA-3b**: Stabilizes at ~0.75, then rises to ~0.8.
- **LLaMA-8b**: Rises to ~0.8, then stabilizes at ~0.85.
- **Qwen-3b**: Rises to ~0.85, then stabilizes at ~0.85.
- **Qwen-7b**: Rises to ~0.85, then stabilizes at ~0.85.
- **Qwen-14b**: Rises to ~0.9, then stabilizes at ~0.9.
- **Qwen-32b**: Rises to ~0.9, then stabilizes at ~0.9.
- **Majority**: Rises to ~0.85, then stabilizes at ~0.85.
### Key Observations
1. **Qwen-32b (Black Line)**: Consistently maintains the highest accuracy across all baselines, with minimal fluctuations.
2. **LLaMA-3b (Red Line)**: Shows the most significant drop at BSS (~0.55) but recovers slightly by DBSs (~0.8).
3. **Majority (Gray Dashed Line)**: Acts as a baseline, with accuracy ranging from ~0.75 to ~0.85 across baselines.
4. **Qwen Models (Green, Blue, Purple, Black)**: Generally outperform LLaMA models, with Qwen-32b being the most robust.
5. **LLaMA-8b (Orange Line)**: Shows moderate performance, with a steady improvement from Baseline to DBSs.
### Interpretation
The data suggests that **Qwen-32b** is the most reliable model across all baselines, maintaining high accuracy with minimal variability. **LLaMA-3b** exhibits the most instability, particularly at BSS, where its accuracy drops sharply. The "majority" line indicates that all models outperform random chance, but Qwen models consistently exceed this baseline. The trends highlight that larger Qwen models (e.g., Qwen-32b) are more robust, while LLaMA models show greater sensitivity to baseline changes. This could imply that Qwen models are better optimized for handling diverse or complex tasks compared to LLaMA.