## Diagram: Cognitive Processing Model of Emotional Response and Behavior
### Overview
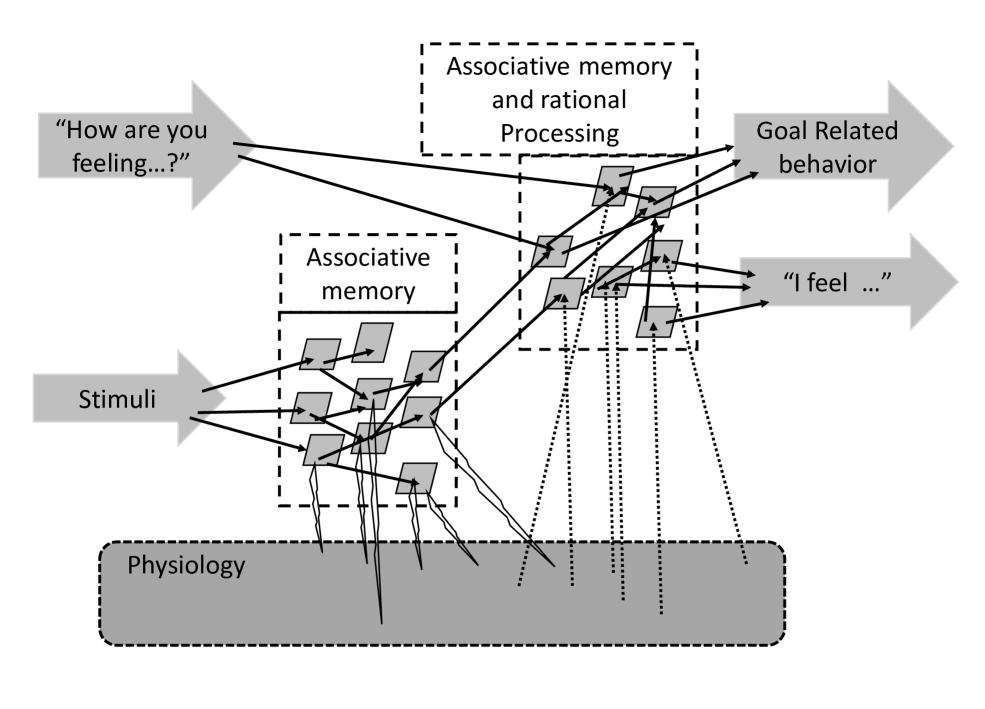
The diagram illustrates a cognitive model depicting the flow of information from external stimuli to internal processing systems (memory and rational processing) and their influence on goal-related behavior. It emphasizes the interplay between physiological states, associative memory, and rational processing in shaping emotional responses and actions.
### Components/Axes
1. **Key Sections**:
- **Stimuli**: External inputs triggering the process.
- **Associative Memory**: Two distinct blocks:
- Primary associative memory (directly connected to stimuli).
- Secondary associative memory (linked to rational processing).
- **Associative Memory and Rational Processing**: A combined system integrating memory and logic.
- **Physiology**: Foundational layer with dotted connections to memory systems.
- **Goal-Related Behavior**: Final output influenced by processed information.
2. **Arrows and Labels**:
- **Input Arrows**:
- "How are you feeling...?" (connects to associative memory and rational processing).
- "Stimuli" (directly feeds into associative memory).
- **Output Arrows**:
- "I feel..." (emerges from associative memory and rational processing).
- "Goal Related Behavior" (final output from the combined system).
3. **Visual Elements**:
- **Shapes**: Rectangular nodes represent memory/processing systems; arrows indicate directional flow.
- **Lines**: Solid lines for direct connections; dotted lines for foundational/indirect links (e.g., physiology to memory).
- **Text Placement**: Labels are positioned near their respective nodes or arrows for clarity.
### Detailed Analysis
- **Stimuli → Associative Memory**: External stimuli directly activate associative memory nodes, suggesting immediate emotional or contextual recall.
- **Associative Memory → Rational Processing**: Memory outputs are integrated with rational processing, indicating a balance between emotional and logical evaluation.
- **Rational Processing → Goal-Related Behavior**: The combined system drives purposeful actions aligned with goals.
- **Physiology**: Positioned at the base, it underpins memory systems via dotted lines, implying physiological states (e.g., stress, arousal) modulate memory accessibility or emotional intensity.
- **Feedback Loops**: Dotted lines from "I feel..." back to associative memory suggest emotional states can reinforce or alter memory associations.
### Key Observations
1. **Hierarchical Flow**: Information progresses from stimuli through memory systems to rational processing, culminating in behavior.
2. **Dual Memory Pathways**: Two associative memory blocks imply parallel processing of emotional and contextual information.
3. **Physiological Influence**: The foundational role of physiology suggests biological states (e.g., hormones, neural activity) indirectly shape cognitive and behavioral outcomes.
4. **Emotional Feedback**: The loop from "I feel..." to memory indicates emotions can retroactively modify memory associations, creating a dynamic system.
### Interpretation
This model demonstrates how external stimuli and internal states (physiology) interact with memory and rational processing to generate emotionally informed, goal-directed behavior. The dotted lines from physiology to memory highlight the body's role in shaping cognitive processes, while the feedback loop from emotions to memory underscores the malleability of associative networks. The integration of rational processing ensures behaviors align with logical goals, balancing instinctual and reasoned responses. The diagram aligns with theories of embodied cognition, where physiological and emotional states are inseparable from cognitive and behavioral outcomes.