# Technical Document Extraction: Context-size Performance Chart
## 1. Component Isolation
* **Header:** None present.
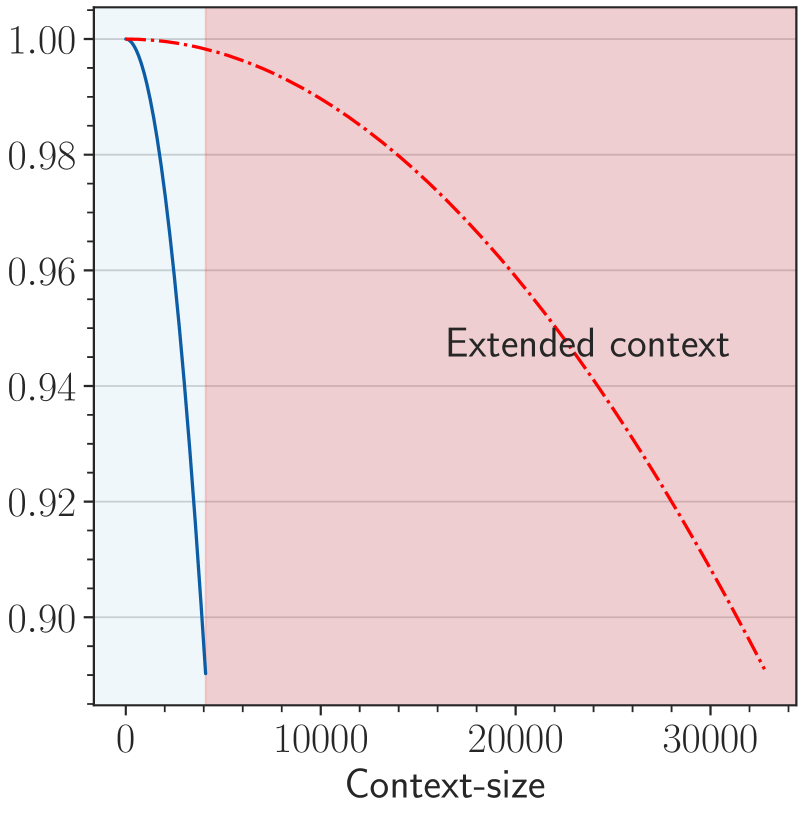
* **Main Chart Area:** A line graph plotting a performance metric (Y-axis) against "Context-size" (X-axis). The background is divided into two distinct colored regions.
* **Footer:** Contains the X-axis label and major tick marks.
## 2. Axis and Labels
* **X-axis Title:** `Context-size`
* **X-axis Scale:** Linear, ranging from 0 to approximately 33,000.
* **Major Ticks:** 0, 10000, 20000, 30000.
* **Minor Ticks:** Present at intervals of 1,000 and 5,000.
* **Y-axis Title:** None explicitly labeled, but represents a normalized value or probability.
* **Y-axis Scale:** Linear, ranging from 0.88 to 1.00.
* **Major Ticks:** 0.90, 0.92, 0.94, 0.96, 0.98, 1.00.
* **Gridlines:** Horizontal grey lines correspond to each major Y-axis tick.
* **Embedded Text:** "Extended context" is located in the center-right of the plot area.
## 3. Background Regions (Spatial Grounding)
The chart area is divided vertically into two shaded regions:
1. **Light Blue Region (Left):** Extends from X = 0 to approximately X = 4,000. This represents the standard or baseline context window.
2. **Light Red Region (Right):** Extends from approximately X = 4,000 to the end of the X-axis (approx. 33,000). This region is associated with the "Extended context" label.
## 4. Data Series Analysis
### Series 1: Standard Performance (Solid Blue Line)
* **Visual Trend:** The line starts at (0, 1.00) and exhibits a very sharp, steep downward slope.
* **Key Data Points:**
* **Start:** [0, 1.00]
* **End:** Terminates abruptly at approximately [4000, 0.89].
* **Observation:** This series represents a rapid degradation in performance as the context size increases beyond a very small threshold, failing completely shortly after the 4,000 mark.
### Series 2: Extended Performance (Dash-Dot Red Line)
* **Visual Trend:** The line starts at (0, 1.00) and exhibits a much more gradual, concave downward slope.
* **Key Data Points:**
* **Start:** [0, 1.00]
* **Mid-point (approx):** [16000, 0.97]
* **End:** [32768 (approx), 0.89]
* **Observation:** This series maintains significantly higher performance over a much larger context window compared to the blue series. It reaches the same degradation level (0.89) at ~32k that the blue series reached at ~4k.
## 5. Summary of Findings
The chart illustrates the effectiveness of an "Extended context" method (Red Dash-Dot line) compared to a baseline method (Blue Solid line).
* **Baseline:** Performance drops precipitously, losing ~11% of its value within the first 4,000 units of context size.
* **Extended:** Performance is preserved much longer, maintaining >95% of its value up to approximately 22,000 units and only reaching the 11% degradation point at roughly 32,000 units.
* **Conclusion:** The extended context method provides approximately an 8x increase in usable context size for the same level of performance degradation.