# Technical Document Extraction: Line Graph Analysis
## Image Description
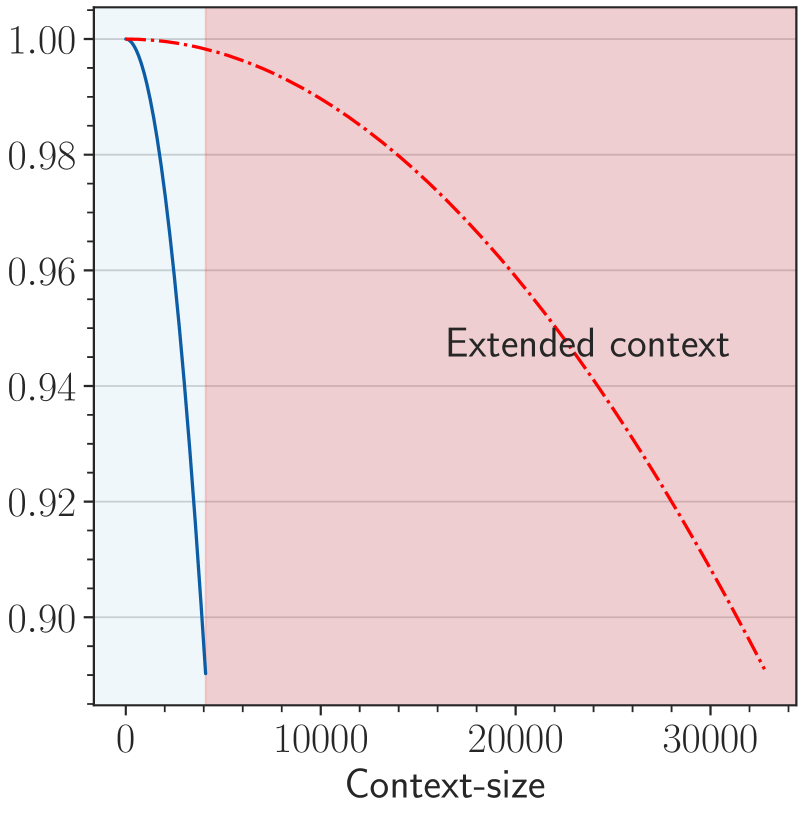
The image is a **line graph** depicting the relationship between **context-size** (x-axis) and an unspecified metric (y-axis). The graph includes two distinct data series, shaded regions, and a legend. The visual elements are structured to highlight differences in trends between the two data series.
---
## Key Components
### 1. **Axes and Labels**
- **X-axis (Horizontal):**
- **Title:** "Context-size"
- **Range:** 0 to 30,000
- **Markers:** 0, 10,000, 20,000, 30,000
- **Y-axis (Vertical):**
- **Title:** Not explicitly labeled (implied metric, e.g., "Value" or "Proportion")
- **Range:** 0.90 to 1.00
- **Markers:** 0.90, 0.92, 0.94, 0.96, 0.98, 1.00
### 2. **Data Series**
- **Blue Solid Line:**
- **Trend:** Starts at (0, 1.00) and sharply declines to (5,000, 0.90), then plateaus.
- **Key Points:**
- (0, 1.00)
- (5,000, 0.90)
- **Legend:** Not explicitly labeled (assumed to represent "Baseline" or "Default" context).
- **Red Dashed Line:**
- **Label:** "Extended context" (annotated in the upper right of the graph).
- **Trend:** Starts at (0, 1.00) and gradually declines to (30,000, 0.90).
- **Key Points:**
- (0, 1.00)
- (30,000, 0.90)
### 3. **Shaded Regions**
- **Blue Shaded Area:**
- **X-range:** 0 to 5,000
- **Purpose:** Likely highlights the "Baseline" or "Default" context range.
- **Red Shaded Area:**
- **X-range:** 5,000 to 30,000
- **Purpose:** Likely highlights the "Extended context" range.
### 4. **Legend**
- **Placement:** Upper right corner of the graph.
- **Content:**
- **Red Dashed Line:** "Extended context"
- **Blue Solid Line:** No explicit label (assumed to represent the default context).
---
## Trends and Observations
1. **Blue Solid Line (Baseline Context):**
- **Initial Drop:** A steep decline from 1.00 to 0.90 between context-sizes 0 and 5,000.
- **Plateau:** Remains at 0.90 for context-sizes beyond 5,000.
2. **Red Dashed Line (Extended Context):**
- **Gradual Decline:** A slow decrease from 1.00 to 0.90 across the entire context-size range (0 to 30,000).
- **Consistency:** Maintains a near-linear decline without plateaus.
3. **Shaded Regions:**
- The blue and red shaded areas visually separate the "Baseline" and "Extended context" ranges, reinforcing the distinction between the two data series.
---
## Spatial Grounding and Color Matching
- **Legend Colors:**
- **Red Dashed Line:** Matches the "Extended context" label.
- **Blue Solid Line:** No label, but matches the blue shaded area (0–5,000).
- **Data Point Verification:**
- All data points align with their respective lines and shaded regions.
---
## Additional Notes
- **No Explicit Y-axis Label:** The y-axis metric is not explicitly named, but the values (0.90–1.00) suggest a proportion or normalized metric.
- **No Data Table:** The graph does not include a data table; trends are inferred from the lines and shaded regions.
- **Language:** All text is in English.
---
## Conclusion
The graph illustrates a comparison between two context types:
- **Baseline Context** (blue solid line): Rapid decline followed by stabilization.
- **Extended Context** (red dashed line): Gradual decline across the entire range.
The shaded regions and legend provide visual cues to differentiate the two contexts.