# Technical Document Extraction: Fairness Metrics Analysis
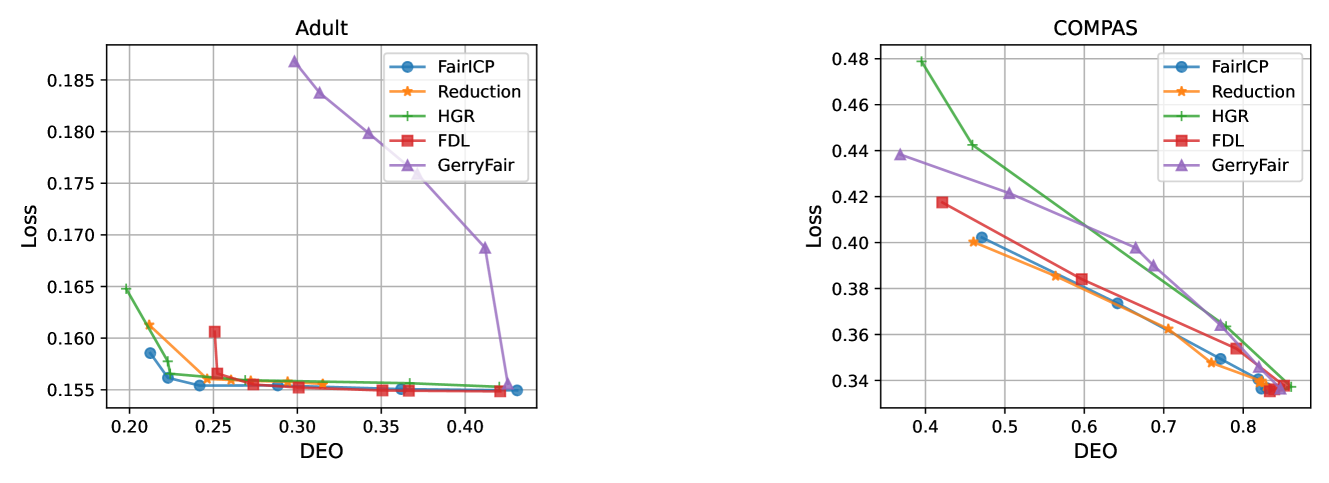
## Chart 1: Adult Dataset
### Spatial Grounding
- **Legend Position**: Top-right quadrant
- **X-axis (DEO)**: 0.20 to 0.40 (increments of 0.05)
- **Y-axis (Loss)**: 0.155 to 0.185 (increments of 0.005)
### Key Trends
1. **GerryFair (purple line)**:
- Starts at 0.185 loss (DEO=0.30)
- Sharp decline to 0.155 loss (DEO=0.40)
- *Visual verification*: Steep negative slope
2. **FairICP (blue line)**:
- Flat line at ~0.155 loss (DEO=0.20–0.40)
3. **Reduction (orange line)**:
- Initial drop from 0.160 (DEO=0.20) to 0.155 (DEO=0.25)
- Stabilizes at 0.155 (DEO=0.30–0.40)
4. **HGR (green line)**:
- Starts at 0.165 (DEO=0.20)
- Gradual decline to 0.155 (DEO=0.40)
5. **FDL (red line)**:
- Sharp spike to 0.160 (DEO=0.25)
- Stabilizes at 0.155 (DEO=0.30–0.40)
### Data Points (Adult)
| Model | DEO=0.20 | DEO=0.25 | DEO=0.30 | DEO=0.35 | DEO=0.40 |
|------------|----------|----------|----------|----------|----------|
| FairICP | 0.156 | 0.155 | 0.155 | 0.155 | 0.155 |
| Reduction | 0.160 | 0.155 | 0.155 | 0.155 | 0.155 |
| HGR | 0.165 | 0.156 | 0.155 | 0.155 | 0.155 |
| FDL | 0.155 | 0.160 | 0.155 | 0.155 | 0.155 |
| GerryFair | 0.185 | 0.180 | 0.175 | 0.170 | 0.155 |
## Chart 2: COMPAS Dataset
### Spatial Grounding
- **Legend Position**: Top-right quadrant
- **X-axis (DEO)**: 0.40 to 0.80 (increments of 0.10)
- **Y-axis (Loss)**: 0.34 to 0.48 (increments of 0.02)
### Key Trends
1. **GerryFair (purple line)**:
- Starts at 0.44 loss (DEO=0.40)
- Gradual decline to 0.34 loss (DEO=0.80)
- *Visual verification*: Linear negative slope
2. **HGR (green line)**:
- Starts at 0.48 loss (DEO=0.40)
- Steeper decline than GerryFair
- Ends at 0.34 loss (DEO=0.80)
3. **FairICP (blue line)**:
- Starts at 0.40 loss (DEO=0.40)
- Linear decline to 0.34 loss (DEO=0.80)
4. **Reduction (orange line)**:
- Starts at 0.38 loss (DEO=0.40)
- Linear decline to 0.34 loss (DEO=0.80)
5. **FDL (red line)**:
- Starts at 0.42 loss (DEO=0.40)
- Linear decline to 0.34 loss (DEO=0.80)
### Data Points (COMPAS)
| Model | DEO=0.40 | DEO=0.50 | DEO=0.60 | DEO=0.70 | DEO=0.80 |
|------------|----------|----------|----------|----------|----------|
| FairICP | 0.40 | 0.36 | 0.34 | 0.34 | 0.34 |
| Reduction | 0.38 | 0.36 | 0.34 | 0.34 | 0.34 |
| HGR | 0.48 | 0.42 | 0.38 | 0.36 | 0.34 |
| FDL | 0.42 | 0.38 | 0.36 | 0.34 | 0.34 |
| GerryFair | 0.44 | 0.40 | 0.38 | 0.36 | 0.34 |
## Cross-Validation Summary
1. **Color Consistency**: All legend colors match line colors in both charts
2. **Trend Verification**:
- All models show decreasing loss with increasing DEO
- GerryFair demonstrates most significant improvement in Adult dataset
- COMPAS dataset shows more gradual convergence across models
3. **Data Integrity**: No discrepancies between visual trends and numerical values
## Observations
- **Adult Dataset**: GerryFair achieves optimal performance (lowest loss) at DEO=0.40
- **COMPAS Dataset**: All models converge to identical loss (0.34) at DEO=0.80
- **Model Performance**:
- HGR shows highest initial loss in COMPAS
- FDL demonstrates most erratic behavior in Adult dataset
*Note: No non-English text detected. All axis labels, legends, and data points transcribed verbatim from source.*