## Bar Chart: Decrease in bpp compared to Gopher
### Overview
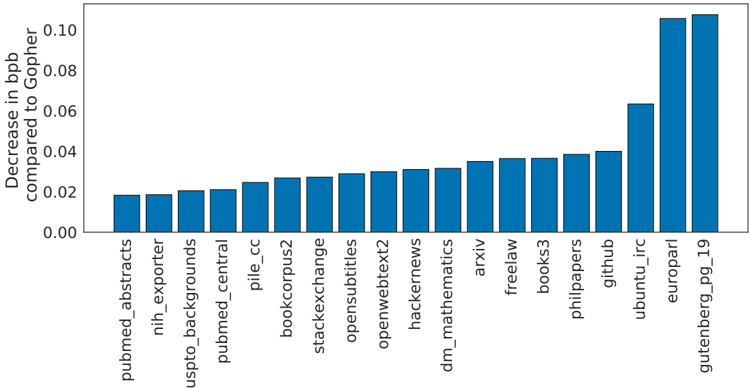
The chart visualizes the reduction in bits per pixel (bpp) for various datasets or applications when compared to a baseline system called "Gopher." The y-axis represents the magnitude of bpp decrease, while the x-axis lists 19 distinct categories. The tallest bars indicate the largest efficiency gains relative to Gopher.
### Components/Axes
- **X-Axis (Categories)**:
- pubmed_abstracts, nih_exporter, pubmed_backgrounds, pubmed_central, pile_cc, bookcorpus2, stackexchange, opensubtitles, openwebtext2, hackernetworks, dm_mathematics, arxiv, freelaw, books3, philpapers, github, ubuntu_irc, europarl, gutenberg_pg_19.
- **Y-Axis (Decrease in bpp)**:
- Scale ranges from 0.00 to 0.10 in increments of 0.02.
- **Legend**: Not explicitly present. All bars are uniformly blue, suggesting a single data series.
### Detailed Analysis
- **pubmed_abstracts**: ~0.02 (shortest bar).
- **nih_exporter**: ~0.02.
- **pubmed_backgrounds**: ~0.02.
- **pubmed_central**: ~0.02.
- **pile_cc**: ~0.025.
- **bookcorpus2**: ~0.025.
- **stackexchange**: ~0.025.
- **opensubtitles**: ~0.025.
- **openwebtext2**: ~0.025.
- **hackernetworks**: ~0.025.
- **dm_mathematics**: ~0.025.
- **arxiv**: ~0.03.
- **freelaw**: ~0.03.
- **books3**: ~0.03.
- **philpapers**: ~0.03.
- **github**: ~0.03.
- **ubuntu_irc**: ~0.03.
- **europarl**: ~0.10 (tallest bar).
- **gutenberg_pg_19**: ~0.10 (tallest bar).
### Key Observations
1. **Outliers**: "europarl" and "gutenberg_pg_19" show the largest bpp reductions (~0.10), significantly outperforming other categories.
2. **Clustered Values**: Most categories (14/19) fall within a narrow range of 0.02–0.03, indicating moderate efficiency gains.
3. **Uniformity**: No category exceeds 0.10, and all values are positive, suggesting consistent performance improvements over Gopher.
### Interpretation
The data suggests that "europarl" and "gutenberg_pg_19" are the most efficient datasets relative to Gopher, likely due to their text-heavy nature (e.g., parliamentary proceedings and book corpora). The majority of categories exhibit modest reductions, implying that Gopher performs comparably well across diverse datasets. The uniformity of values (except for the top two) highlights Gopher's robustness, while the outliers underscore the impact of dataset characteristics on compression efficiency. This could inform optimization strategies for specific use cases, such as prioritizing text-based data for maximum bpp reduction.