\n
## Bar Chart: Decrease in bpb Compared to Gopher
### Overview
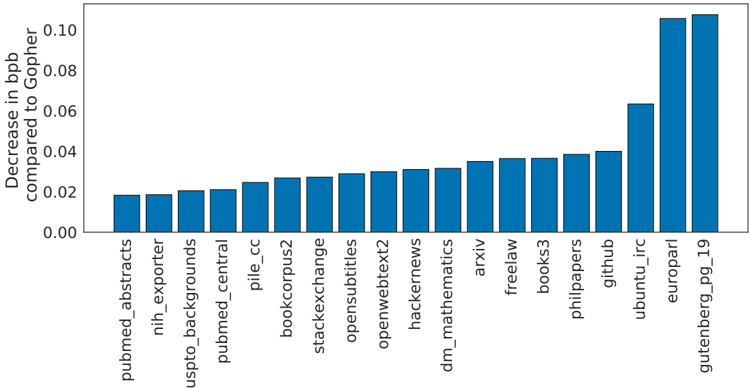
This is a bar chart displaying the decrease in bits per byte (bpb) for various datasets when compared to the Gopher language model. The x-axis represents the dataset name, and the y-axis represents the decrease in bpb. The bars are all blue and arranged in ascending order of decrease in bpb.
### Components/Axes
* **X-axis Label:** Dataset Name
* **Y-axis Label:** Decrease in bpb compared to Gopher
* **Y-axis Scale:** 0.00 to 0.10 (approximately)
* **Datasets (X-axis):** pubmed_abstracts, nih_exporter, uspto_backgrounds, pubmed_central, pile_cc, bookcorpus2, stackexchange, opensubtitles, openwebtext2, hackernews, dm_mathematics, arxiv, freelaw, books3, philpapers, github, ubuntu_irc, europarl, gutenberg_pg_19
### Detailed Analysis
The chart shows a clear trend of increasing decrease in bpb as we move from left to right across the datasets.
Here's a breakdown of approximate values, reading from left to right:
* **pubmed_abstracts:** ~0.012
* **nih_exporter:** ~0.014
* **uspto_backgrounds:** ~0.016
* **pubmed_central:** ~0.018
* **pile_cc:** ~0.021
* **bookcorpus2:** ~0.022
* **stackexchange:** ~0.023
* **opensubtitles:** ~0.025
* **openwebtext2:** ~0.028
* **hackernews:** ~0.030
* **dm_mathematics:** ~0.032
* **arxiv:** ~0.034
* **freelaw:** ~0.036
* **books3:** ~0.038
* **philpapers:** ~0.040
* **github:** ~0.044
* **ubuntu_irc:** ~0.062
* **europarl:** ~0.075
* **gutenberg_pg_19:** ~0.095
The largest decrease in bpb is observed for the "gutenberg_pg_19" dataset (~0.095), while the smallest decrease is seen for "pubmed_abstracts" (~0.012).
### Key Observations
* The decrease in bpb is relatively small for the first several datasets (pubmed_abstracts through bookcorpus2), ranging from approximately 0.012 to 0.022.
* There's a noticeable jump in the decrease in bpb between "books3" (~0.038) and "github" (~0.044).
* "gutenberg_pg_19" stands out significantly with the highest decrease in bpb.
* The data appears to be consistently increasing, with no major dips or plateaus.
### Interpretation
The chart demonstrates the effectiveness of the Gopher language model in compressing different types of data. A larger decrease in bpb indicates better compression performance. The fact that "gutenberg_pg_19" (Project Gutenberg, 19th-century literature) exhibits the largest decrease suggests that Gopher is particularly well-suited for compressing text from this domain. Conversely, the smaller decreases for datasets like "pubmed_abstracts" and "nih_exporter" might indicate that these datasets have characteristics that make them less compressible by Gopher, or that Gopher's architecture is less optimized for biomedical text.
The consistent upward trend suggests that Gopher generally performs better on datasets that are more amenable to its compression algorithms. The differences in compression performance across datasets could be due to variations in vocabulary, sentence structure, and the presence of specialized terminology. This information is valuable for understanding the strengths and weaknesses of the Gopher model and for selecting appropriate datasets for training and evaluation.