\n
## Diagram: Functional Programming Illustration
### Overview
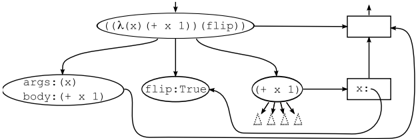
The image depicts a diagram illustrating a functional programming concept, likely related to function application and evaluation. It shows a flow of data and operations, with labeled components representing functions, arguments, and intermediate results. The diagram uses a combination of rounded rectangles, squares, and arrows to represent these elements.
### Components/Axes
The diagram consists of the following components:
* **Top Ellipse:** `((λ(x) (+ x 1)) (flip))`
* **Left Ellipse:** `args: (x) \n body: (+ x 1)`
* **Middle Ellipse:** `flip:True`
* **Bottom Ellipse:** `(+ x 1)` with four triangle-shaped inputs.
* **Top-Right Rectangle:** Unlabeled, with an arrow entering from the top ellipse and exiting upwards.
* **Bottom-Right Rectangle:** Labeled `x:`. with an arrow entering from the bottom ellipse and exiting upwards.
* **Arrows:** Indicate the flow of data and control between the components.
### Detailed Analysis or Content Details
The diagram illustrates a function application process.
1. The top ellipse represents a function composition: `((λ(x) (+ x 1)) (flip))`. This suggests applying the `flip` function to the lambda expression `(λ(x) (+ x 1))`.
2. The left ellipse breaks down the lambda expression into its `args` (arguments) which is `(x)` and `body` which is `(+ x 1)`.
3. The middle ellipse represents the `flip` function with the value `True`.
4. The bottom ellipse represents the function `(+ x 1)`. It has four triangle-shaped inputs, suggesting it can accept multiple arguments.
5. The top-right rectangle receives input from the top ellipse and outputs upwards, likely representing the result of the function composition.
6. The bottom-right rectangle labeled `x:` receives input from the bottom ellipse and outputs upwards, representing the value of `x`.
7. The arrows show the flow of data. The top ellipse sends data to the top-right rectangle. The left ellipse and middle ellipse both send data to the bottom ellipse. The bottom ellipse sends data to the bottom-right rectangle. There is a feedback loop from the bottom-right rectangle to the bottom ellipse.
### Key Observations
* The diagram highlights the application of a function (`flip`) to another function (`λ(x) (+ x 1)`).
* The `flip` function is set to `True`, which likely alters the order of arguments in the function application.
* The feedback loop suggests an iterative or recursive process.
* The triangle-shaped inputs to `(+ x 1)` are unusual and may represent multiple arguments or a specific input pattern.
### Interpretation
The diagram demonstrates a functional programming concept where functions are treated as first-class citizens and can be passed as arguments to other functions. The `flip` function is a higher-order function that modifies the behavior of the function it's applied to. The feedback loop suggests that the result of the function application is used as input in subsequent iterations, potentially implementing a recursive algorithm. The diagram is a visual representation of how functions are composed and applied in a functional programming paradigm. The use of lambda expressions and higher-order functions is a key characteristic of this approach. The diagram doesn't provide specific numerical data, but rather illustrates the logical flow of a functional computation. The diagram is a conceptual illustration, and the exact behavior depends on the specific implementation of the `flip` function and the context in which it's used.