## Horizontal Bar Chart: Improvement over Base Model by Category
### Overview
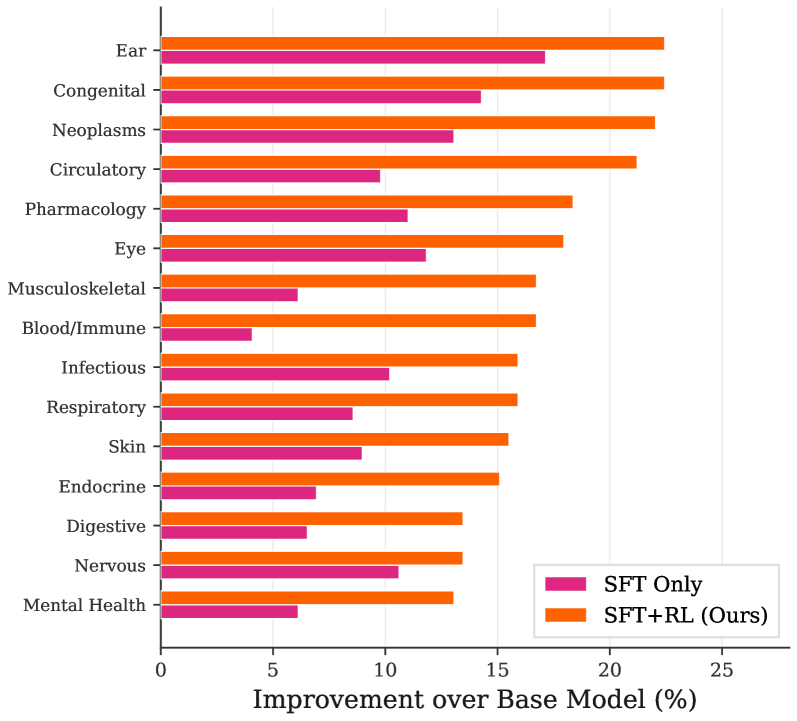
The image is a horizontal bar chart comparing the improvement over a base model for two different methods (SFT Only and SFT+RL (Ours)) across various categories. The x-axis represents the percentage of improvement, and the y-axis lists the categories.
### Components/Axes
* **Title:** There is no explicit title on the chart.
* **X-axis:** "Improvement over Base Model (%)". The scale ranges from 0% to 25% with tick marks at intervals of 5%.
* **Y-axis:** Categories: Ear, Congenital, Neoplasms, Circulatory, Pharmacology, Eye, Musculoskeletal, Blood/Immune, Infectious, Respiratory, Skin, Endocrine, Digestive, Nervous, Mental Health.
* **Legend:** Located in the bottom-right corner.
* Pink: SFT Only
* Orange: SFT+RL (Ours)
### Detailed Analysis
The chart displays the improvement of two models, "SFT Only" and "SFT+RL (Ours)", over a base model, across 15 different categories. The length of each bar corresponds to the percentage of improvement.
**SFT Only (Pink Bars):**
* Mental Health: ~4%
* Nervous: ~7%
* Digestive: ~7%
* Endocrine: ~6%
* Skin: ~8%
* Respiratory: ~8%
* Infectious: ~10%
* Blood/Immune: ~4%
* Musculoskeletal: ~5%
* Eye: ~11%
* Pharmacology: ~12%
* Circulatory: ~14%
* Neoplasms: ~15%
* Congenital: ~14%
* Ear: ~16%
**SFT+RL (Ours) (Orange Bars):**
* Mental Health: ~12%
* Nervous: ~14%
* Digestive: ~14%
* Endocrine: ~15%
* Skin: ~16%
* Respiratory: ~16%
* Infectious: ~16%
* Blood/Immune: ~15%
* Musculoskeletal: ~17%
* Eye: ~18%
* Pharmacology: ~18%
* Circulatory: ~21%
* Neoplasms: ~22%
* Congenital: ~22%
* Ear: ~24%
**Trend Verification:**
For each category, the orange bar (SFT+RL) is longer than the pink bar (SFT Only), indicating that SFT+RL consistently outperforms SFT Only across all categories.
### Key Observations
* SFT+RL (Ours) consistently shows a higher improvement over the base model compared to SFT Only across all categories.
* The "Ear" category shows the highest improvement for both methods.
* The "Mental Health" category shows the lowest improvement for both methods.
* The difference in improvement between SFT Only and SFT+RL is most pronounced in the "Mental Health" category.
### Interpretation
The data suggests that incorporating Reinforcement Learning (RL) into the SFT model (SFT+RL) leads to a significant improvement in performance across all tested categories compared to using SFT alone. The magnitude of improvement varies by category, indicating that the benefit of RL is not uniform across different tasks or domains. The "Ear" category benefits the most from both methods, while "Mental Health" shows the least improvement, suggesting that these categories may have inherent differences in complexity or data availability. The consistent outperformance of SFT+RL highlights the potential of combining supervised fine-tuning with reinforcement learning for enhancing model performance.