# Technical Data Extraction: Accuracy vs. Context Length Chart
## 1. Component Isolation
* **Header:** None present.
* **Main Chart Area:** A 2D line plot featuring a single data series plotted against a grid.
* **Footer/Axes:** Contains the primary labels and numerical scales for the X and Y axes.
## 2. Axis and Label Extraction
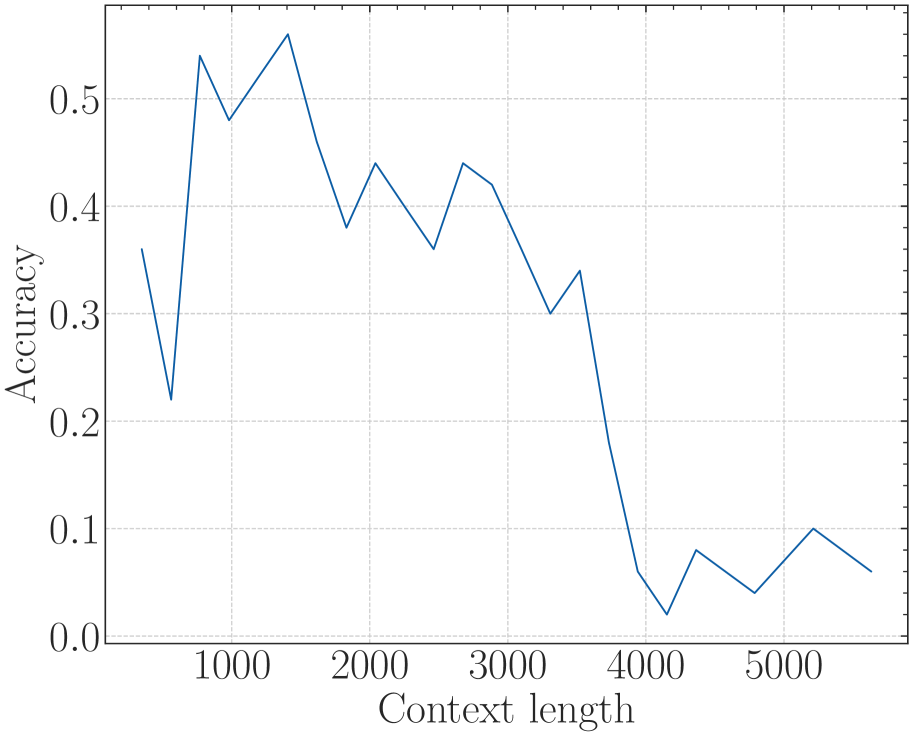
* **Y-Axis Label:** `Accuracy` (Vertical orientation, left side).
* **Y-Axis Scale:** Numerical values ranging from `0.0` to `0.5` with major ticks every 0.1 units.
* **X-Axis Label:** `Context length` (Horizontal orientation, bottom center).
* **X-Axis Scale:** Numerical values ranging from `1000` to `5000` with major ticks every 1000 units. Minor ticks are visible between major intervals.
## 3. Data Series Analysis
* **Series Name:** Not explicitly labeled (Single series).
* **Color:** Dark Blue.
* **Visual Trend:**
* **Initial Volatility (0 - 1500):** The line starts at approximately 0.36, drops sharply to ~0.22, then climbs rapidly to its peak.
* **Peak Performance (1500):** Reaches its maximum value.
* **Gradual Decline (1500 - 3500):** The line exhibits a "sawtooth" downward trend, maintaining accuracy between 0.3 and 0.45.
* **Sharp Degradation (3500 - 4200):** A steep, near-linear drop in accuracy occurs.
* **Baseline/Noise (4200 - 5500+):** The accuracy flattens out at a very low level (below 0.1), showing minor fluctuations.
## 4. Data Point Extraction (Estimated)
Based on the grid intersections and axis markers, the following data points are extracted:
| Context Length (X) | Accuracy (Y) | Notes |
| :--- | :--- | :--- |
| ~400 | 0.36 | Starting point |
| ~600 | 0.22 | Local minimum |
| ~800 | 0.54 | Sharp recovery |
| 1000 | 0.48 | |
| ~1400 | 0.56 | **Global Maximum** |
| ~1600 | 0.46 | |
| ~1800 | 0.38 | |
| ~2100 | 0.44 | |
| ~2500 | 0.36 | |
| ~2700 | 0.44 | |
| ~2900 | 0.42 | |
| ~3300 | 0.30 | |
| ~3500 | 0.34 | Final peak before collapse |
| ~3900 | 0.06 | End of sharp decline |
| ~4200 | 0.02 | **Global Minimum** |
| ~4400 | 0.08 | |
| ~4800 | 0.04 | |
| ~5200 | 0.10 | |
| ~5600 | 0.06 | Final data point |
## 5. Summary of Findings
The chart illustrates a performance degradation of a system (likely a Large Language Model) as the input context length increases.
* **Optimal Range:** Context lengths between 800 and 1500 yield the highest accuracy (>0.5).
* **Stability Range:** Between 1500 and 3500, the system maintains a moderate accuracy (0.3 - 0.45).
* **Failure Point:** Beyond a context length of 3500, accuracy collapses significantly, suggesting the system reaches a functional limit or "context window" boundary, resulting in near-zero accuracy for lengths greater than 4000.