## Routing Mechanism Diagram
### Overview
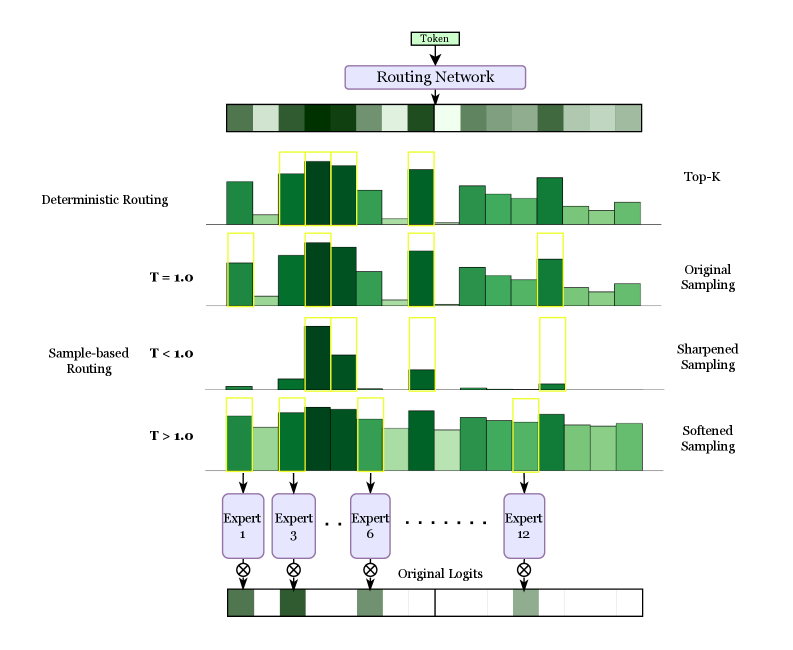
The image is a diagram illustrating different routing mechanisms, comparing deterministic routing with sample-based routing under varying temperature parameters (T). It shows how a "Token" is processed through a "Routing Network" and then routed to different "Experts" based on the routing mechanism and temperature. The diagram compares "Top-K", "Original Sampling", "Sharpened Sampling", and "Softened Sampling" methods.
### Components/Axes
* **Top**: A box labeled "Token" points to a "Routing Network" represented by a horizontal bar with varying shades of green.
* **Left Side**: Labels "Deterministic Routing" and "Sample-based Routing" categorize the routing mechanisms.
* **Temperature (T)**: Values of T are given as T = 1.0, T < 1.0, and T > 1.0.
* **Right Side**: Labels "Top-K", "Original Sampling", "Sharpened Sampling", and "Softened Sampling" correspond to the routing mechanisms and temperature values.
* **Bottom**: "Experts" are represented as boxes labeled "Expert 1", "Expert 3", "Expert 6", and "Expert 12". An ellipsis indicates that there are more experts in between.
* **Bottom**: "Original Logits" are represented by a horizontal bar with varying shades of green.
### Detailed Analysis
* **Routing Network**: The "Routing Network" bar at the top shows a sequence of blocks with varying shades of green, suggesting different routing probabilities or weights.
* **Deterministic Routing (Top-K)**: This section shows a bar graph-like representation. The bars are of varying heights and shades of green. Some bars are highlighted with a yellow outline, indicating the "Top-K" experts selected.
* **Original Sampling (T = 1.0)**: Similar to the "Top-K" section, this shows a bar graph with varying heights and shades of green. Some bars are highlighted with a yellow outline.
* **Sample-based Routing (Sharpened Sampling, T < 1.0)**: This section shows a bar graph where the bars are more sparse and have more extreme heights (either very low or very high). Some bars are highlighted with a yellow outline.
* **Sample-based Routing (Softened Sampling, T > 1.0)**: This section shows a bar graph where the bars are more evenly distributed in height and shade of green. Some bars are highlighted with a yellow outline.
* **Experts**: The "Experts" are labeled 1, 3, 6, and 12. Arrows point from the bar graphs above to these experts, indicating the routing of the token.
* **Original Logits**: The "Original Logits" bar at the bottom shows a sequence of blocks with varying shades of green, representing the initial logits before routing.
* **Multiplication Symbol**: A multiplication symbol is shown between the experts and the original logits.
### Key Observations
* **Deterministic Routing**: The "Top-K" routing mechanism selects a fixed number of experts based on the highest probabilities.
* **Sample-based Routing**: The routing behavior changes based on the temperature (T).
* When T < 1.0 (Sharpened Sampling), the routing becomes more selective, focusing on a few experts with high probabilities.
* When T > 1.0 (Softened Sampling), the routing becomes more distributed, assigning probabilities to a wider range of experts.
* **Expert Selection**: The yellow outlines highlight the experts that are selected by each routing mechanism.
### Interpretation
The diagram illustrates how different routing mechanisms and temperature parameters affect the selection of experts in a system. Deterministic routing selects the top-k experts, while sample-based routing allows for more flexible selection based on the temperature. When the temperature is low (T < 1.0), the sampling is sharpened, focusing on a few experts. When the temperature is high (T > 1.0), the sampling is softened, distributing the probabilities across more experts. The "Original Logits" represent the initial state before routing, and the multiplication symbol suggests that the expert outputs are combined with these logits. The diagram demonstrates the trade-offs between exploration (softened sampling) and exploitation (sharpened sampling) in routing decisions.