TECHNICAL ASSET FINGERPRINT
6b0b6e474b226f0447264da0
Click to view fullscreen
Press ESC or click to close
FOUND IN PAPERS
EXPERT: healer-alpha-free VERSION 1
RUNTIME: free/openrouter/healer-alpha
INTEL_VERIFIED
## Diagram: Routing Mechanisms in a Mixture-of-Experts (MoE) Model
### Overview
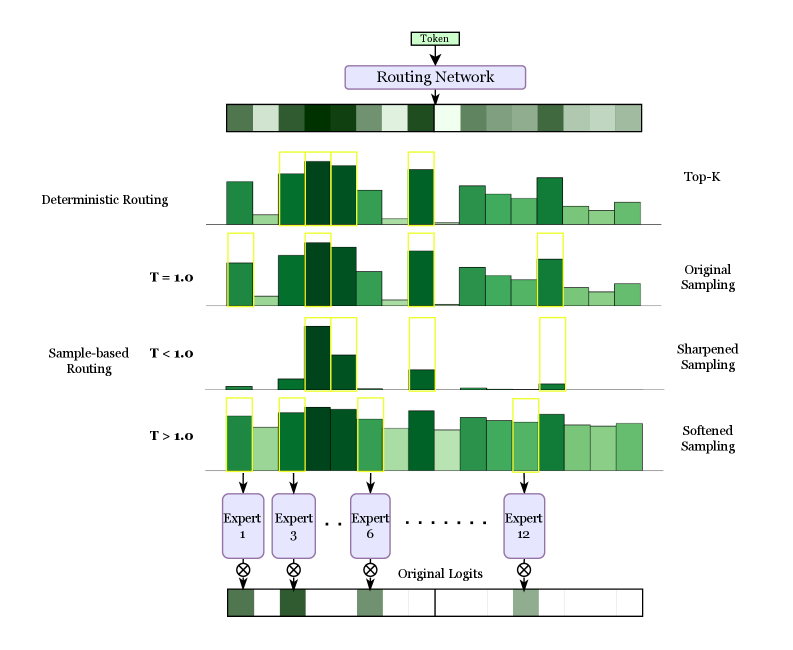
This image is a technical diagram illustrating and comparing two primary methods for routing input tokens to a set of "experts" within a neural network architecture, likely a Mixture-of-Experts (MoE) model. It visually contrasts **Deterministic Routing** (Top-K) with **Sample-based Routing** under different temperature (T) settings. The flow proceeds from a single input token at the top, through a routing network, to the selection of specific experts, and finally to the combination of expert outputs.
### Components/Axes
The diagram is organized vertically into distinct sections:
1. **Input & Routing Network (Top):**
* A box labeled **"Token"** at the very top center.
* An arrow points down to a purple box labeled **"Routing Network"**.
* Below this is a horizontal bar composed of 12 adjacent rectangles in varying shades of green, representing the initial routing weights or logits for 12 experts.
2. **Deterministic Routing (Upper Middle):**
* **Left Label:** "Deterministic Routing"
* **Right Label:** "Top-K"
* **Visual:** A bar chart with 12 green bars of varying heights. The top 3 bars (experts) are highlighted with yellow outlines, indicating they are selected deterministically based on the highest weights.
3. **Sample-based Routing (Lower Middle):**
This section is subdivided into three rows, each showing a different sampling behavior controlled by a temperature parameter `T`.
* **Row 1 (T = 1.0):**
* **Left Label:** "T = 1.0"
* **Right Label:** "Original Sampling"
* **Visual:** A bar chart where the distribution of weights is similar to the deterministic case, but the yellow-highlighted selections (experts 1, 3, and 6) are not strictly the top 3 tallest bars, indicating stochastic sampling.
* **Row 2 (T < 1.0):**
* **Left Label:** "T < 1.0"
* **Right Label:** "Sharpened Sampling"
* **Visual:** The weight distribution is more peaked. The selected experts (again 1, 3, 6) correspond to the most prominent peaks, showing how low temperature makes sampling more deterministic and focused.
* **Row 3 (T > 1.0):**
* **Left Label:** "T > 1.0"
* **Right Label:** "Softened Sampling"
* **Visual:** The weight distribution is flatter and more uniform. The selected experts (1, 3, 6) are chosen from a broader, less skewed set of probabilities, demonstrating how high temperature increases exploration.
4. **Expert Selection & Output (Bottom):**
* Arrows from the selected expert positions (1, 3, 6, and 12 is implied by the ellipsis) point down to purple boxes labeled **"Expert 1"**, **"Expert 3"**, **"Expert 6"**, and **"Expert 12"**.
* Ellipses (`...`) between Expert 6 and Expert 12 indicate the presence of other experts (4, 5, 7-11) not explicitly drawn.
* Below each expert box is a circle with an "X" (⊗), symbolizing a multiplication or gating operation.
* These operations feed into a final horizontal bar labeled **"Original Logits"**, which is a segmented bar showing the contribution from each selected expert.
### Detailed Analysis
* **Routing Weight Visualization:** The initial green bar (below "Routing Network") and all subsequent bar charts represent a probability distribution or weight vector over 12 experts. The height of each bar corresponds to the routing weight for that expert.
* **Selection Mechanism - Deterministic (Top-K):** The system selects the `K` experts with the highest weights. In this diagram, `K=3`. The yellow boxes consistently highlight experts at positions 1, 3, and 6 across all examples for comparison, though in a true Top-K, these would be the three tallest bars in the first chart.
* **Selection Mechanism - Sample-based:** Experts are selected by sampling from the weight distribution. The temperature `T` modifies this distribution before sampling:
* **T = 1.0:** Uses the original routing weights (`softmax(logits)`) as probabilities.
* **T < 1.0 (Sharpened):** Applying a temperature `T < 1` to the logits before softmax makes the distribution more peaked (e.g., `softmax(logits / 0.5)`). This increases the probability of selecting high-weight experts and reduces the chance of selecting low-weight ones.
* **T > 1.0 (Softened):** Applying a temperature `T > 1` flattens the distribution (e.g., `softmax(logits / 2.0)`), making the selection more uniform and exploratory.
* **Expert Output Combination:** The final "Original Logits" bar suggests that the outputs from the selected experts are weighted and combined to produce the final representation for the input token.
### Key Observations
1. **Consistent Expert Highlighting:** For visual comparison, the diagram uses the same set of selected experts (1, 3, 6) across all routing methods. This is a pedagogical choice; in practice, the selected set would vary, especially for sample-based methods.
2. **Temperature Effect:** The visual contrast between "Sharpened" (T<1.0) and "Softened" (T>1.0) sampling is clear. The sharpened chart has one very tall bar and several very short ones, while the softened chart has bars of more similar heights.
3. **Spatial Layout:** The legend/labels are placed on the left ("Deterministic Routing", "Sample-based Routing", T values) and right ("Top-K", "Original Sampling", etc.) of the respective chart rows. The expert boxes are aligned vertically below their corresponding positions in the charts above.
4. **Flow Direction:** The process flows unidirectionally from top (input) to bottom (output), with clear arrows indicating the sequence of operations.
### Interpretation
This diagram serves as an educational tool to explain the core mechanism of dynamic routing in MoE models. It demonstrates how a single input token is directed to a subset of specialized neural network sub-modules ("experts").
* **Deterministic vs. Stochastic:** It highlights the trade-off between **Deterministic Routing (Top-K)**, which is efficient and stable but may not always select the most appropriate experts, and **Sample-based Routing**, which introduces stochasticity that can improve model robustness and load balancing across experts during training.
* **Role of Temperature:** The temperature parameter `T` is shown as a crucial "knob" for controlling the exploration-exploitation trade-off. A low `T` favors exploitation (confidently picking the best-seeming experts), while a high `T` increases exploration.
* **Expert Output Combination:** The final "Original Logits" bar suggests that the outputs from the selected experts are weighted and combined to produce the final representation for the input token.
DECODING INTELLIGENCE...