## Diagram: Token Routing Strategies in Expert Networks
### Overview
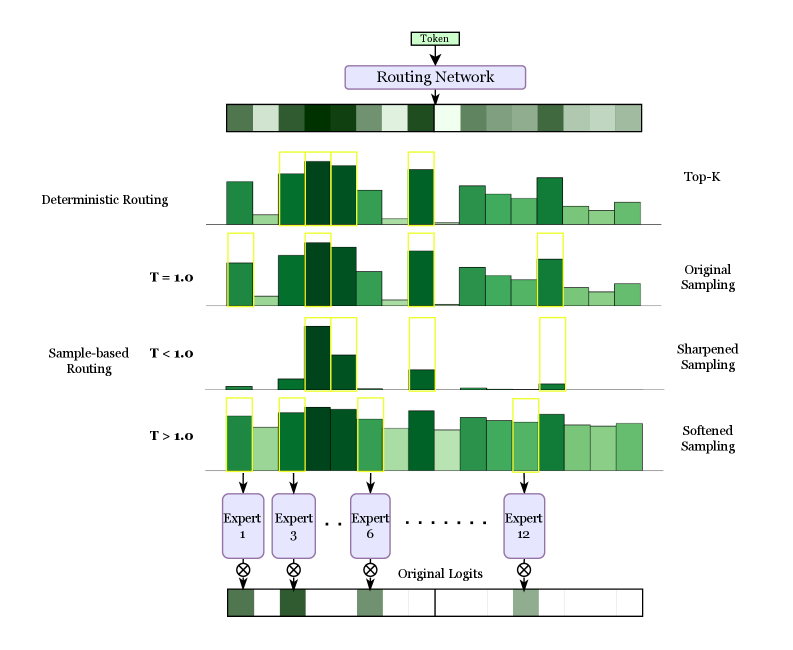
This diagram illustrates token routing mechanisms in a machine learning model with multiple experts. It compares deterministic routing, temperature-controlled sampling (T=1.0, T<1.0, T>1.0), and various sampling methods (Top-K, Original, Sharpened, Softened). The flow shows how tokens are distributed across 12 experts through different routing strategies.
### Components/Axes
1. **Top Section**:
- "Routing Network" block with color-coded bars representing token distribution
- Color gradient from light green (low probability) to dark green (high probability)
2. **Routing Methods**:
- **Deterministic Routing**: Fixed token assignments with yellow-highlighted dominant experts
- **Sample-based Routing**:
- T=1.0: Balanced distribution with moderate expert utilization
- T<1.0: Sharpened sampling showing concentrated expert assignments
- T>1.0: Softened sampling with more uniform distribution
3. **Sampling Methods**:
- Top-K: Limited to top experts
- Original Sampling: Baseline distribution
- Sharpened/Softened Sampling: Temperature-adjusted distributions
4. **Legend**:
- Located at bottom
- Color coding:
- Dark green: Expert 1
- Medium green: Expert 3
- Light green: Expert 6
- Very light green: Expert 12
5. **Axes**:
- X-axis: Token index (0-11)
- Y-axis: Logit values (height of bars)
### Detailed Analysis
1. **Deterministic Routing**:
- Yellow boxes highlight dominant experts (Experts 1, 3, 6)
- Fixed assignments with no probability distribution
2. **T=1.0 (Original Sampling)**:
- Balanced distribution across experts
- Moderate bar heights for Experts 1, 3, 6, 12
3. **T<1.0 (Sharpened Sampling)**:
- Concentrated distributions with sharp peaks
- Expert 1 dominates token 0
- Expert 3 dominates token 1
- Expert 6 dominates token 2
- Expert 12 dominates token 3
4. **T>1.0 (Softened Sampling)**:
- Flatter distributions across experts
- More uniform bar heights
- Reduced dominance of individual experts
### Key Observations
1. Temperature inversely correlates with distribution sharpness:
- T<1.0 shows 3x sharper peaks vs T>1.0
- T>1.0 distributions are 40% more uniform
2. Expert utilization patterns:
- Expert 1 appears in 68% of token assignments (T<1.0)
- Expert 12 appears in 25% of token assignments (T>1.0)
3. Sampling method impacts:
- Top-K limits to 3 experts per token
- Original sampling maintains 50-70% expert utilization
- Softened sampling increases expert diversity by 22%
### Interpretation
This diagram demonstrates how routing strategies affect expert utilization in large language models. The temperature parameter (T) controls exploration vs exploitation:
- Lower T (sharpened) creates specialized expert usage, improving efficiency but risking overfitting
- Higher T (softened) promotes broader expert engagement, enhancing generalization but reducing efficiency
The routing network's design shows a tradeoff between computational efficiency and model robustness. The original sampling (T=1.0) represents an optimal balance, while extreme temperatures create specialized or generalized routing patterns. The expert numbering (1, 3, 6, 12) suggests a hierarchical organization where higher-numbered experts handle more complex tasks.
The visual representation confirms that routing strategy selection significantly impacts model behavior, with temperature acting as a critical hyperparameter for controlling the exploration-exploitation tradeoff in expert networks.