## Line Chart: Reward Value vs. Training Steps
### Overview
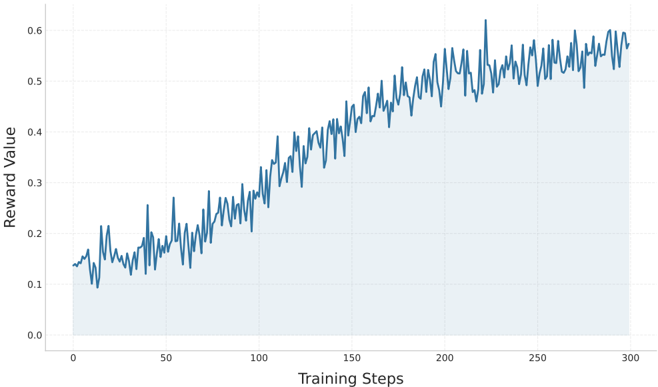
The image is a line chart showing the relationship between "Reward Value" and "Training Steps". The chart displays how the reward value changes as the number of training steps increases. The area under the line is shaded in light blue.
### Components/Axes
* **X-axis:** "Training Steps" with markers at 0, 50, 100, 150, 200, 250, and 300.
* **Y-axis:** "Reward Value" with markers at 0.0, 0.1, 0.2, 0.3, 0.4, 0.5, and 0.6.
* **Data Series:** A single line in dark blue representing the reward value over training steps. The area under the line is shaded light blue.
### Detailed Analysis
* **Data Series Trend:** The dark blue line shows an upward trend in reward value as training steps increase.
* From 0 to approximately 100 training steps, the reward value fluctuates between approximately 0.1 and 0.25.
* From 100 to 200 training steps, the reward value increases significantly, rising from approximately 0.25 to 0.5.
* From 200 to 300 training steps, the reward value continues to increase, but at a slower rate, fluctuating around 0.5 to 0.6.
### Key Observations
* The reward value increases significantly between 100 and 200 training steps.
* The reward value appears to plateau after 200 training steps, with smaller gains.
* There is some fluctuation in the reward value throughout the training process.
### Interpretation
The chart suggests that the training process is effective in increasing the reward value, particularly in the early stages (up to 200 training steps). The plateauing of the reward value after 200 steps may indicate that the training is reaching a point of diminishing returns, or that further optimization is needed. The fluctuations in reward value could be due to the inherent variability in the training environment or the learning algorithm.