## Line Chart with Shaded Area: Reward Value vs. Training Steps
### Overview
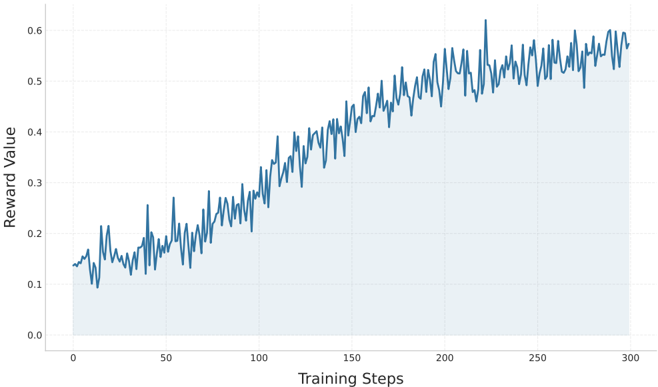
The image displays a line chart plotting "Reward Value" against "Training Steps," typical of a reinforcement learning or optimization process. The chart shows a single data series with high volatility but a clear upward trend, with the area under the line shaded in light blue.
### Components/Axes
* **X-Axis (Horizontal):**
* **Label:** "Training Steps"
* **Scale:** Linear scale from 0 to 300.
* **Major Tick Marks:** 0, 50, 100, 150, 200, 250, 300.
* **Y-Axis (Vertical):**
* **Label:** "Reward Value"
* **Scale:** Linear scale from 0.0 to 0.6.
* **Major Tick Marks:** 0.0, 0.1, 0.2, 0.3, 0.4, 0.5, 0.6.
* **Data Series:**
* A single, jagged blue line representing the reward value at each training step.
* A light blue shaded area fills the space between the data line and the x-axis (y=0).
* **Legend:** No separate legend is present. The single data series is implicitly defined by the line and its label on the y-axis.
* **Grid:** Faint, light gray grid lines are present for both major x and y ticks.
### Detailed Analysis
* **Trend Verification:** The primary data series (blue line) exhibits a strong, positive, upward trend from left to right. The line is highly volatile, with frequent sharp peaks and troughs, but the overall slope is consistently positive.
* **Data Point Extraction (Approximate Values):**
* **Start (Step 0):** Reward Value ≈ 0.15.
* **Step 50:** Reward Value fluctuates between ≈ 0.12 and ≈ 0.25.
* **Step 100:** Reward Value fluctuates between ≈ 0.20 and ≈ 0.35.
* **Step 150:** Reward Value fluctuates between ≈ 0.35 and ≈ 0.45.
* **Step 200:** Reward Value fluctuates between ≈ 0.45 and ≈ 0.55.
* **Peak (≈ Step 220):** The highest observed point reaches a Reward Value of approximately 0.62.
* **End (Step 300):** Reward Value fluctuates between ≈ 0.55 and ≈ 0.60.
* **Volatility:** The magnitude of fluctuations appears relatively consistent throughout the training, though the absolute range of the fluctuations increases as the mean reward increases (e.g., fluctuations of ±0.05 at step 50 vs. ±0.05 at step 250, but on a higher baseline).
### Key Observations
1. **Consistent Improvement:** Despite significant noise, the agent or model demonstrates consistent learning, as evidenced by the clear upward trend in reward over 300 training steps.
2. **High Variance:** The process is highly stochastic. The reward value at any given step is not a smooth function of the step number, indicating significant variability in performance between consecutive evaluations or episodes.
3. **Potential Plateau:** In the final 50-100 steps (from ~200 to 300), the rate of improvement appears to slow. The trend line becomes less steep, suggesting the learning process may be approaching an asymptote or plateau.
4. **Notable Outlier:** A single, prominent spike occurs just after step 200 (≈220), where the reward sharply exceeds 0.6 before returning to the prevailing trend. This could represent a particularly successful episode or a measurement anomaly.
### Interpretation
This chart is a classic learning curve for a machine learning model, most likely in a reinforcement learning context. The "Reward Value" is the objective function being maximized, and "Training Steps" represent iterations of the learning algorithm.
* **What the data suggests:** The model is successfully learning the task. The positive correlation between training steps and reward indicates that the policy or parameters are being updated in a beneficial direction. The high variance is typical in RL, where exploration, environmental stochasticity, and delayed rewards cause performance to fluctuate.
* **How elements relate:** The x-axis (time/effort) drives the increase in the y-axis (performance). The shaded area emphasizes the cumulative or sustained nature of the reward, though it is primarily a visual aid here.
* **Notable Patterns & Anomalies:** The slowing improvement in the later stages is a critical observation. It may indicate that the model is nearing its performance capacity given the current hyperparameters, or that the learning rate may need adjustment (e.g., decay) for fine-tuning. The single high spike is an outlier that warrants investigation—it could be a lucky run or hint at a region of the state space with exceptionally high reward that the model has not yet learned to reliably access.
* **Peircean Investigation:** The chart is an **index** of the learning process (it directly points to the fact that learning occurred) and a **symbol** of model performance (we interpret the upward trend as "good"). The volatility is a **quale** of the training process itself, representing its inherent instability. The plateau is a **hypothesis** suggesting a limit has been reached, prompting the next investigative question: "What change is needed to break through this apparent ceiling?"