## Line Graph: Reward Value vs Training Steps
### Overview
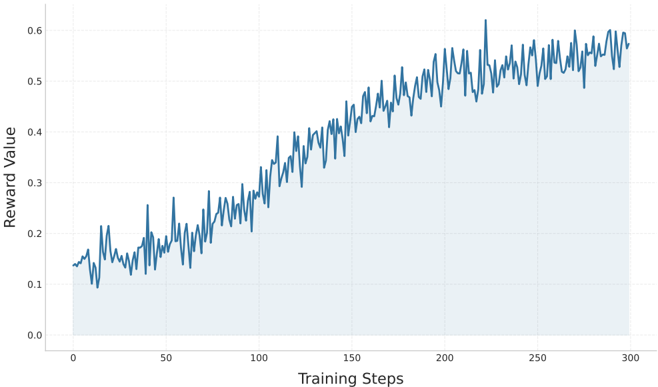
The image depicts a line graph illustrating the relationship between "Training Steps" (x-axis) and "Reward Value" (y-axis). The graph shows a fluctuating but generally increasing trend in reward value over 300 training steps, with a shaded area beneath the line indicating variability or confidence intervals.
### Components/Axes
- **X-axis (Training Steps)**:
- Labeled "Training Steps" with numerical markers at 0, 50, 100, 150, 200, 250, and 300.
- Scale ranges from 0 to 300.
- **Y-axis (Reward Value)**:
- Labeled "Reward Value" with increments of 0.1 from 0.0 to 0.6.
- Scale ranges from 0.0 to 0.6.
- **Legend**:
- No explicit legend is present, but the line is colored blue.
- **Grid**:
- Light gray grid lines overlay the background for reference.
- **Shaded Area**:
- A light blue shaded region under the line, likely representing a confidence interval or average range.
### Detailed Analysis
- **Line Behavior**:
- The blue line starts at approximately **0.12** at 0 training steps.
- It exhibits **moderate fluctuations** (e.g., peaks at ~0.25 at 50 steps, ~0.35 at 100 steps, ~0.45 at 150 steps, ~0.55 at 200 steps).
- After 200 steps, the line stabilizes around **0.55–0.6**, with minor oscillations.
- **Shaded Area**:
- The shaded region under the line suggests a **confidence interval** or **average reward range**, though its exact interpretation is unclear without additional context.
### Key Observations
1. **Initial Growth**: The reward value increases steadily from ~0.12 to ~0.6 over the first 200 training steps.
2. **Stabilization**: After 200 steps, the reward value plateaus with minor fluctuations, indicating convergence.
3. **Fluctuations**: The line’s jagged nature suggests variability in reward calculation, possibly due to stochastic elements in the training process.
4. **Shaded Region**: The light blue area under the line implies a range of values, but its purpose (e.g., standard deviation, moving average) is not explicitly defined.
### Interpretation
The graph demonstrates that the reward value improves with training steps, reflecting a model’s increasing performance over time. The stabilization after 200 steps suggests that the model reaches a steady state, with diminishing returns on additional training. The fluctuations highlight the inherent variability in the training process, while the shaded area may indicate uncertainty or aggregation of data points. This trend is critical for understanding the efficiency of the training algorithm and identifying potential overfitting or convergence thresholds.