## Line Chart: Test Time Search Performance on AMC
### Overview
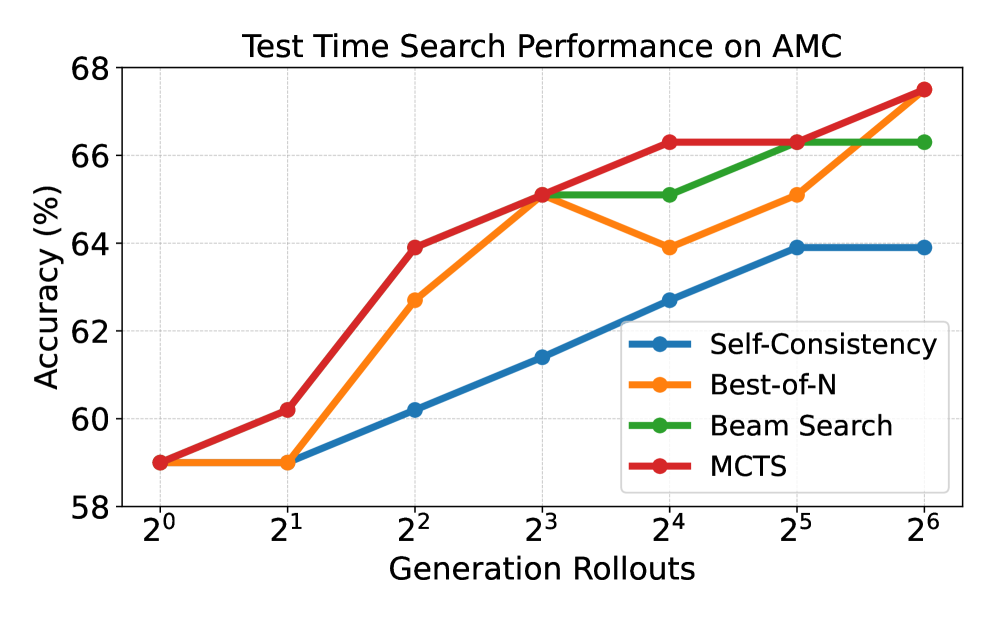
The chart visualizes the accuracy performance of four search methods (Self-Consistency, Best-of-N, Beam Search, MCTS) across logarithmic generation rollouts (2⁰ to 2⁶). Accuracy is measured on the y-axis (58%–68%), with distinct colored lines representing each method.
### Components/Axes
- **X-axis**: Generation Rollouts (logarithmic scale: 2⁰, 2¹, ..., 2⁶)
- **Y-axis**: Accuracy (%) (linear scale: 58%–68%)
- **Legend**: Located in the bottom-right corner, mapping colors to methods:
- Blue: Self-Consistency
- Orange: Best-of-N
- Green: Beam Search
- Red: MCTS
### Detailed Analysis
1. **Self-Consistency (Blue)**:
- Starts at ~59% (2⁰), increases steadily to ~64% (2⁶), with a plateau at 2⁵–2⁶.
- Values: 59% (2⁰), 59% (2¹), 60% (2²), 61% (2³), 62.5% (2⁴), 64% (2⁵–2⁶).
2. **Best-of-N (Orange)**:
- Begins at ~59% (2⁰), peaks at ~65% (2³), dips to ~64% (2⁴), then rises to ~67% (2⁶).
- Values: 59% (2⁰), 59% (2¹), 63% (2²), 65% (2³), 64% (2⁴), 65% (2⁵), 67% (2⁶).
3. **Beam Search (Green)**:
- Starts at ~59% (2⁰), rises to ~66% (2⁵–2⁶), with a plateau at 2⁵–2⁶.
- Values: 59% (2⁰), 59% (2¹), 60% (2²), 65% (2³), 65% (2⁴), 66% (2⁵–2⁶).
4. **MCTS (Red)**:
- Consistently increases from ~59% (2⁰) to ~67.5% (2⁶), with no plateaus.
- Values: 59% (2⁰), 60% (2¹), 64% (2²), 65% (2³), 66.5% (2⁴), 66.5% (2⁵), 67.5% (2⁶).
### Key Observations
- **MCTS** demonstrates the highest and most consistent growth, outperforming all methods by 2⁶.
- **Best-of-N** shows volatility, peaking at 2³ before recovering at 2⁶.
- **Beam Search** lags initially but matches MCTS at 2⁵–2⁶.
- **Self-Consistency** has the slowest growth, plateauing at 64% by 2⁵.
### Interpretation
The data suggests **MCTS** is the most effective method for improving search accuracy over time, with a clear advantage at higher rollouts. **Best-of-N** and **Beam Search** show competitive performance but with less stability. **Self-Consistency** underperforms relative to others, indicating potential limitations in scalability. The logarithmic x-axis emphasizes performance gains at larger rollouts, highlighting MCTS's efficiency in resource-intensive scenarios.