\n
## Line Chart: Test Time Search Performance on AMC
### Overview
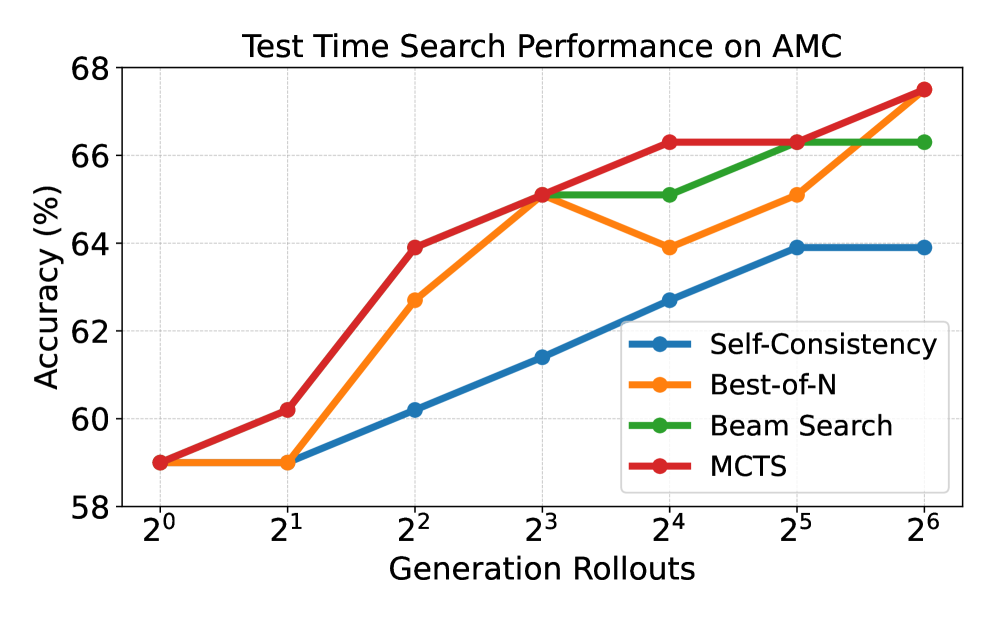
The image displays a line chart comparing the performance of four different search algorithms or strategies on the AMC (likely a benchmark dataset or task) as a function of computational budget, measured in "Generation Rollouts." The chart plots Accuracy (%) against the number of rollouts on a logarithmic scale (base 2).
### Components/Axes
* **Chart Title:** "Test Time Search Performance on AMC" (centered at the top).
* **Y-Axis:** Labeled "Accuracy (%)". The scale runs from 58 to 68, with major tick marks every 2 units (58, 60, 62, 64, 66, 68).
* **X-Axis:** Labeled "Generation Rollouts". The scale is logarithmic, with tick marks at powers of two: 2⁰, 2¹, 2², 2³, 2⁴, 2⁵, 2⁶.
* **Legend:** Positioned in the bottom-right quadrant of the chart area. It contains four entries, each with a colored line segment and a marker:
* **Blue line with circle markers:** "Self-Consistency"
* **Orange line with circle markers:** "Best-of-N"
* **Green line with circle markers:** "Beam Search"
* **Red line with circle markers:** "MCTS"
### Detailed Analysis
The chart tracks four data series. All series begin at the same point (59% accuracy at 2⁰ rollouts). Below is the extracted data and trend for each series.
**1. Self-Consistency (Blue Line)**
* **Trend:** Shows a steady, near-linear increase in accuracy as rollouts increase, but plateaus at the highest rollout counts.
* **Data Points (Approximate):**
* 2⁰: 59.0%
* 2¹: 59.0%
* 2²: 60.2%
* 2³: 61.4%
* 2⁴: 62.7%
* 2⁵: 63.9%
* 2⁶: 63.9%
**2. Best-of-N (Orange Line)**
* **Trend:** Exhibits a volatile but overall strong upward trend. It shows a significant jump between 2¹ and 2², a peak at 2³, a dip at 2⁴, and then a strong recovery to reach the highest final accuracy.
* **Data Points (Approximate):**
* 2⁰: 59.0%
* 2¹: 59.0%
* 2²: 62.7%
* 2³: 65.1%
* 2⁴: 63.9%
* 2⁵: 65.1%
* 2⁶: 67.5%
**3. Beam Search (Green Line)**
* **Trend:** Demonstrates a consistent upward trend that plateaus in the middle range (2³ to 2⁴) before a final increase.
* **Data Points (Approximate):**
* 2⁰: 59.0%
* 2¹: 59.0%
* 2²: 63.9%
* 2³: 65.1%
* 2⁴: 65.1%
* 2⁵: 66.3%
* 2⁶: 66.3%
**4. MCTS (Red Line)**
* **Trend:** Shows the most consistent and steepest upward trajectory, with no dips. It matches the highest accuracy at the final data point.
* **Data Points (Approximate):**
* 2⁰: 59.0%
* 2¹: 60.2%
* 2²: 63.9%
* 2³: 65.1%
* 2⁴: 66.3%
* 2⁵: 66.3%
* 2⁶: 67.5%
### Key Observations
1. **Common Starting Point:** All four methods begin at an identical accuracy of 59% with a single rollout (2⁰).
2. **Performance Hierarchy at Scale:** At the maximum rollout count (2⁶ = 64), MCTS and Best-of-N are tied for the highest performance (~67.5%), followed by Beam Search (~66.3%), with Self-Consistency performing the lowest (~63.9%).
3. **Divergence Point:** The performance of the methods begins to diverge significantly after 2¹ rollouts.
4. **Plateau Behavior:** Self-Consistency plateaus after 2⁵ rollouts. Beam Search shows a plateau between 2³ and 2⁴. MCTS and Best-of-N show no sign of plateauing within the measured range.
5. **Volatility:** Best-of-N is the only method to show a decrease in accuracy (at 2⁴) before recovering.
### Interpretation
This chart demonstrates the scaling behavior of different search strategies with respect to computational budget (rollouts). The key insight is that more sophisticated search methods (MCTS, Best-of-N) exhibit better scaling laws—they continue to gain significant accuracy as more computation is allocated, whereas simpler methods like Self-Consistency see diminishing returns earlier.
The data suggests that for the AMC task, investing in increased rollouts is most beneficial when using MCTS or Best-of-N strategies. The dip in Best-of-N at 2⁴ could indicate sensitivity to a specific rollout count or a potential instability in the method that is overcome with even more samples. The identical starting point implies that with minimal computation, the choice of search strategy is irrelevant; their value is unlocked only when sufficient computational resources are available for exploration. The final tie between MCTS and Best-of-N at 2⁶ raises the question of whether one might eventually outperform the other with even larger budgets, or if they have converged to a similar performance ceiling for this task.