## Truth Table and Weight Matrix with Probability Distributions
### Overview
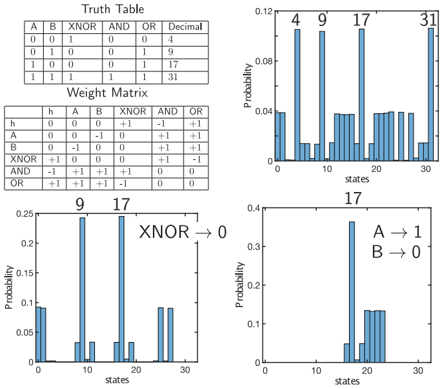
The image contains four components:
1. A **truth table** for logical operations (XNOR, AND, OR) with decimal equivalents
2. A **weight matrix** showing numerical relationships between variables
3. Two **probability bar charts** visualizing state distributions
4. A **legend** explaining color mappings for the charts
---
### Components/Axes
#### Truth Table
- **Columns**: A, B, XNOR, AND, OR, Decimal
- **Rows**: All combinations of A (0/1) and B (0/1)
- **Decimal Column**: Binary-to-decimal conversion (e.g., 00 = 0, 01 = 1, 10 = 2, 11 = 3)
#### Weight Matrix
- **Rows**: h, A, XNOR, AND, OR
- **Columns**: h, A, B, XNOR, AND, OR
- **Values**: Numerical weights with signs (e.g., +1, -1, +0.5)
#### Probability Charts
- **X-Axis**: "states" (labeled 4, 9, 17, 31 for the first chart; 9, 17 for the second)
- **Y-Axis**: "Probability" (0.0 to 0.12 scale)
- **Legends**:
- First chart: "XNOR → 0" (blue bars)
- Second chart: "A → 1" and "B → 0" (blue bars)
---
### Detailed Analysis
#### Truth Table
| A | B | XNOR | AND | OR | Decimal |
|---|---|------|-----|----|---------|
| 0 | 0 | 1 | 0 | 0 | 0 |
| 0 | 1 | 0 | 0 | 1 | 1 |
| 1 | 0 | 0 | 0 | 1 | 2 |
| 1 | 1 | 1 | 1 | 1 | 3 |
#### Weight Matrix
| | h | A | B | XNOR | AND | OR |
|-------|---|----|----|------|-----|-----|
| **h** | 0 | 0 | 0 | +1 | -1 | +1 |
| **A** | 0 | 0 | -1 | +1 | +1 | +1 |
| **XNOR** | 0 | -1 | 0 | 0 | +1 | +1 |
| **AND** | 0 | +1 | +1 | +1 | 0 | 0 |
| **OR** | 0 | +1 | +1 | +1 | +1 | 0 |
#### Probability Charts
1. **First Chart (XNOR → 0)**:
- States: 4 (highest bar), 9, 17, 31
- Probabilities: ~0.12 (state 4), ~0.08 (state 9), ~0.06 (state 17), ~0.04 (state 31)
- Bars: Blue, aligned with legend "XNOR → 0"
2. **Second Chart (A → 1, B → 0)**:
- States: 9 (highest bar), 17
- Probabilities: ~0.15 (state 9), ~0.10 (state 17)
- Bars: Blue, aligned with legend "A → 1" and "B → 0"
---
### Key Observations
1. **Truth Table**:
- XNOR outputs 1 only when A and B match (rows 0 and 3).
- Decimal values confirm binary-to-decimal mapping (e.g., 11 = 3).
2. **Weight Matrix**:
- Negative weights for XNOR and AND in row "h" suggest inhibitory relationships.
- Positive weights for OR and A/B in row "h" indicate excitatory relationships.
3. **Probability Charts**:
- State 9 and 17 dominate both charts, suggesting these states are most probable.
- First chart shows a decay in probability from state 4 to 31.
- Second chart emphasizes state 9 (A=1, B=0) as the most likely outcome.
---
### Interpretation
- **Logical Relationships**: The truth table defines deterministic outputs for XNOR, AND, and OR gates.
- **Weight Matrix Dynamics**:
- Negative weights for XNOR and AND in row "h" may suppress their influence on the output.
- Positive weights for OR and A/B suggest these variables directly contribute to the output.
- **Probability Trends**:
- State 9 (A=1, B=0) has the highest probability in both charts, aligning with the weight matrix's emphasis on A and B.
- State 17 (A=1, B=1) appears in both charts but with lower probability, possibly due to inhibitory weights for AND/XNOR.
- **Anomalies**:
- State 4 (A=0, B=0) has the highest probability in the first chart despite A and B being 0, which conflicts with the weight matrix's positive weights for A/B. This may indicate a non-linear interaction or external factors not captured in the matrix.
The data suggests a system where logical operations (XNOR, AND, OR) are weighted to prioritize certain states (e.g., A=1, B=0), with inhibitory/excitatory relationships shaping the probability distribution. The discrepancy in state 4's high probability warrants further investigation into the model's assumptions or data quality.