## Diagram Analysis: Symbolic-Neural System Architecture
### Overview
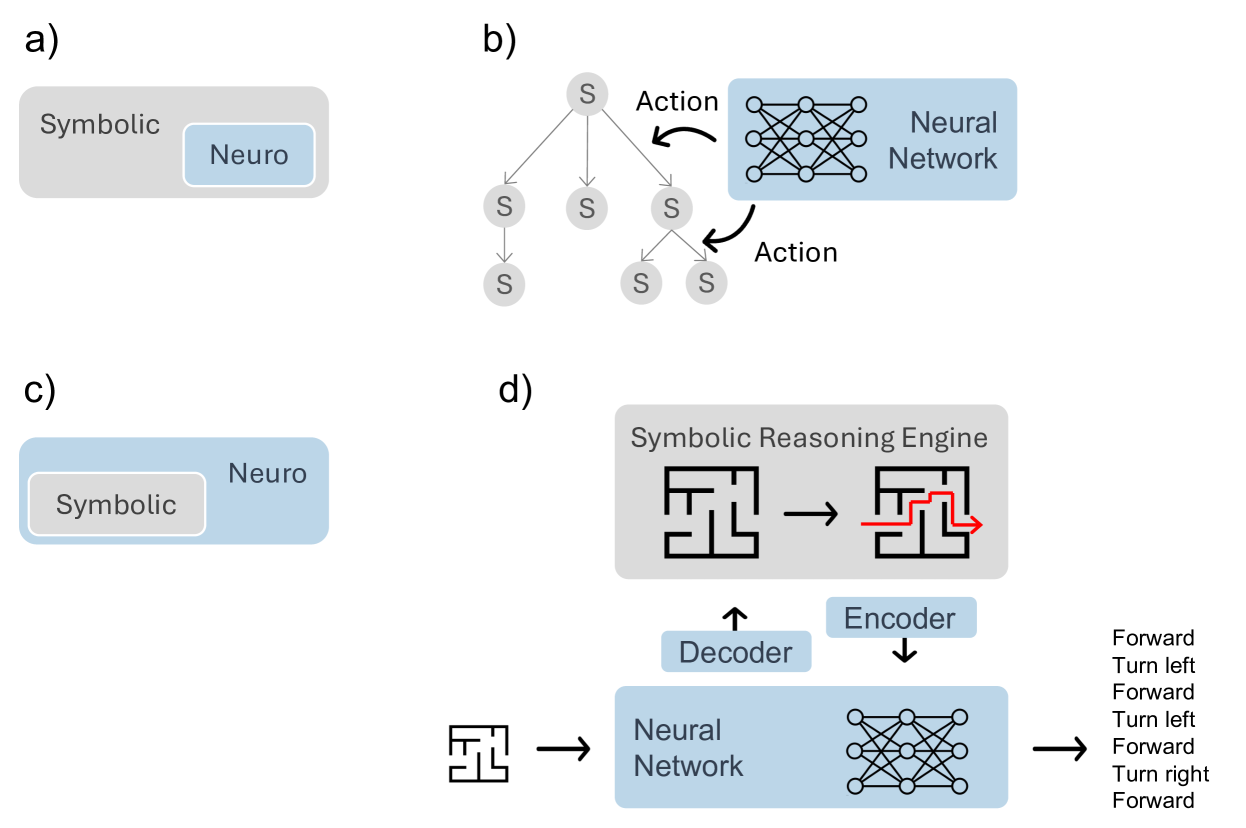
The image presents four diagrams (a-d) illustrating the relationship between symbolic reasoning systems and neural networks. Each diagram represents different integration approaches, with clear visual distinctions between symbolic (gray) and neural (blue) components.
### Components/Axes
**Diagram a)**
- Left: Gray rectangle labeled "Symbolic"
- Right: Blue rectangle labeled "Neuro"
- Spatial relationship: Symbolic component positioned left of neural component
**Diagram b)**
- Tree structure with 7 "S" nodes (symbolic states)
- Two-way arrows labeled "Action" connecting tree to neural network
- Neural network depicted as interconnected nodes
- Spatial flow: Symbolic tree (left) → Neural network (right)
**Diagram c)**
- Blue rectangle labeled "Neuro"
- Gray rectangle labeled "Symbolic"
- Spatial inversion: Neural component positioned left of symbolic component
**Diagram d)**
- Top: "Symbolic Reasoning Engine" with maze diagram
- Middle: Encoder/Decoder components
- Bottom: Neural network with action outputs
- Arrows show information flow:
Symbolic Reasoning Engine → Encoder → Neural Network → Decoder → Action Outputs
- Action outputs: Forward, Turn left, Forward, Turn right, Forward
### Detailed Analysis
**Diagram a)**
- Basic symbolic-neural dichotomy
- No explicit connection mechanism shown
**Diagram b)**
- Symbolic decision tree (7 states) directly interfaces with neural network
- Bidirectional action flow suggests hybrid processing
**Diagram c)**
- Reversed symbolic-neural arrangement compared to a)
- Implies alternative integration paradigm
**Diagram d)**
- Most complex architecture
- Symbolic reasoning engine processes maze-like environment
- Encoder converts symbolic input to neural network format
- Decoder translates neural outputs back to symbolic actions
- Action sequence demonstrates pathfinding behavior
### Key Observations
1. All diagrams maintain clear symbolic (gray) vs neural (blue) color coding
2. Diagrams a-c show different symbolic-neural arrangements
3. Diagram d) demonstrates full integration pipeline with explicit encoding/decoding
4. Action outputs in d) show concrete pathfinding decisions
5. Neural network consistently depicted as interconnected nodes across diagrams
### Interpretation
The diagrams collectively illustrate the evolution of symbolic-neural integration:
1. From simple dichotomy (a) to direct interface (b)
2. Through reversed architecture (c) to full hybrid system (d)
3. Diagram d) represents the most sophisticated approach, showing how symbolic reasoning (maze navigation) can be encoded into neural network processing and decoded into actionable commands
4. The encoder-decoder pattern in d) suggests a transformer-like architecture for symbolic-neural translation
5. Action sequence demonstrates practical application in navigation tasks
This progression implies increasing sophistication in symbolic-neural integration, with diagram d) representing a complete closed-loop system capable of environmental perception, decision-making, and action execution.